
China captured headlines in 2010 when its GDP surpassed Japan’s, creating a shift in the world economic hierarchy for the first time in 40 years. However, that same year, China began showing signs that its rapid growth rate was losing steam.
In 2015, China’s growth was again at the center of international headlines, but the focus was instead on the slowdown of the world’s second-largest economy. Much has been made of China’s adjustment to the “new normal,” even as US-China Business Council (USCBC) companies reported that China remains a priority market that delivers more growth than most other markets around the globe. But China is not a monolith, and local-level growth patterns suggest the emergence of the new model.
Breaking it down
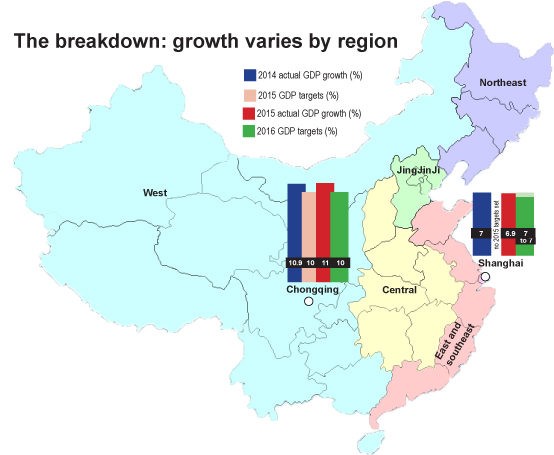
Despite outside skepticism about China’s economic statistics, 6.9 percent growth indicates at least one hard fact: overall growth has slowed to a 25-year low. Such a slowdown is to be expected as China’s economy gets larger and year-over-year numbers become mathematically harder to sustain. Size matters, however. The GDP added to China’s economy in 2015 at the 6.9 percent growth rate was greater than the GDP added to China’s economy 10 years ago when it grew more than 12 percent. In addition, differences in regional growth rates highlight a more revealing picture. Three provinces and one provincial-level municipality—Guizhou, Tibet, Gansu, and Chongqing—grew more than 10 percent while two rust-belt provinces—Liaoning and Shanxi—reported more dismal growth rates near 3 percent. At the same time, many provinces, such as Guangdong, Jiangsu, Shandong, Zhejiang, and Henan, saw stable growth of about 8 percent.
The discrepancy lies in China’s economic diversity, and the growth engines that differ from region to region. For instance, provinces that have relied on traditional areas of Chinese industry–such as coal, heavy industry, or sectors dominated by China’s state owned enterprises–have seen the sharpest declines in economic growth rates. USCBC analysis of government sources shows how, and sometimes why, local growth rates differ from adjacent regions.
JingJinJi
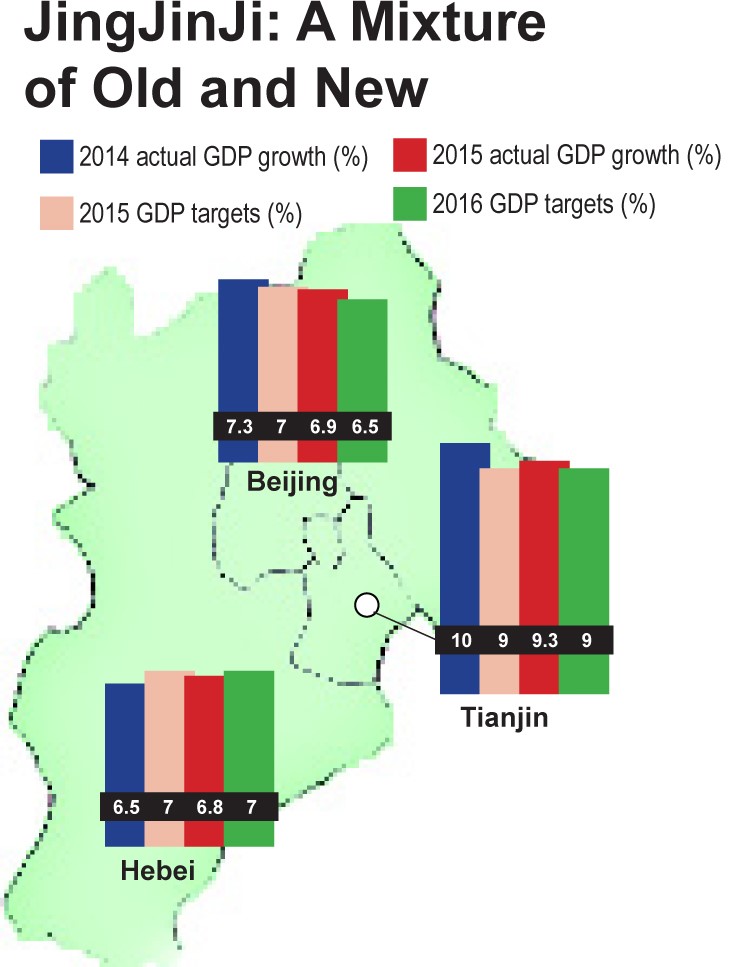
The Beijing-Tianjin-Hebei region (referred to as “JingJinJi” in China’s economic plans, using their Chinese language shorthand names) serves as an important economic region in Northern China accounting for about 10 percent of national GDP in 2014 and 2015.
Policymakers have long discussed integrating the JingJinJi area into a centralized megalopolis, under the direction of a national-level initiative known as the “JingJinJi Integrated Development Plan.” While not yet released to the public, the idea is to use Beijing’s position as a technological innovation hub and China’s political center, Tianjin’s position as a leader in advanced manufacturing, shipping, and financial innovation, and Hebei’s position as a logistical service base to revitalize and create a regional growth engine based on services and clean development.
The different individual growth rates of Jing, Jin, and Ji represent the potential challenges that integration may bring. Tianjin’s 2015 rate of 9 percent indicates that the city is still enjoying relatively high levels of growth, while Beijing and Hebei’s more modest rates of 6.9 and 6.8 percent, respectively, indicate slowing growth during a time of transition, as the localities tackle industrial overcapacity and the shutting or relocation of high-polluting industries.
It’s difficult to say how growth in the region may be affected in the next five years, as China embarks on supply-side reform under the 13th Five-Year Plan. Hebei is China’s largest producer of steel, and the local government announced in early March, before the posting of its GDP target, that it would be cutting 60 percent of its steel output by 2020. Whether integration with Beijing and Tianjin can help Hebei achieve its GDP growth rate for 2016 remains unclear.
Municipalities
In addition to Beijing and Tianjin, China’s other two large municipalities—Shanghai and Chongqing—posted 2015 rates that speak to how China’s slowdown is felt by different areas in different ways.
Following Shanghai’s 7 percent GDP growth in 2014, the city opted out of setting a target for 2015, the only province or municipality to break precedent. Official 2015 figures indicate the city’s GDP growth clocked in at 6.9 percent. Local media points to strong headwinds in the global trade environment, slowing investment as Shanghai reorients itself as a more services-oriented economic model, and the relocation of low-value manufacturing due to tightening resource constraints. In addition, Shanghai’s economic size also means that its top-line growth rate is likely to naturally slow. Policymakers this year set a flexible growth target of 6.5 to 7 percent growth.
By contrast, over the past few years Chongqing has posted strong official GDP growth gains, increasing slightly from 10.9 percent in 2014 to 11 percent in 2015. Its location in Sichuan province has presumably allowed it to benefit from central policies aimed at western development, such as the One Belt One Road Initiative and government
incentives for attracting investment.
The rust-belt provinces
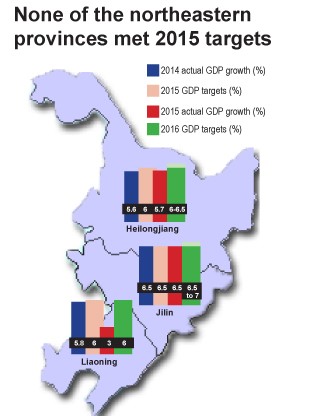
The slowdown hit the rust-belt northeastern provinces of Heilongjiang, Jilin, and Liaoning particularly hard. None of the provinces met the official 6.9 percent national growth rate. Heilongjiang and Liaoning missed their targets and Jilin simply matched its 6.5 percent goal.
The area, home to Chinese heavy industry, includes the coal, iron, steel, and aluminum sectors. Like an old colossus, China’s heavy industry base is staggering, encumbered with outdated industrial structure and a large number of inefficient, debt-ridden, state-owned enterprises. These economic woes, coupled with decelerated population growth (and, as a result, a weakened real estate market), have painted northeast China as the symbol of the economic slowdown.
The eastern & southeastern coastal areas
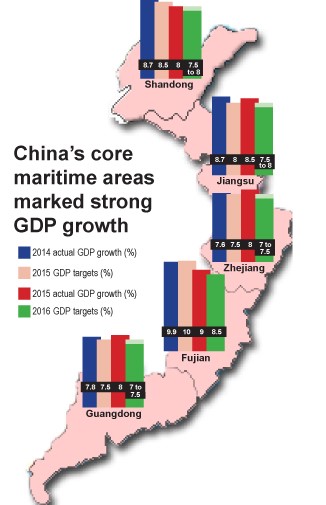
In contrast to the hardship of the North, China’s five eastern and southeastern coastal provinces announced growth beyond 8 percent in 2015. Four of them—Guangdong, Jiangsu, Shandong, and Zhejiang—posted GDP rates of 8 or 8.5 percent, and Fujian recorded 9 percent. Two provinces missed their 2015 target.
These coastal regions have been designated as core maritime areas of the One Belt One Road Initiative. The focus on development is expected to push Fujian into the top 10 fastest-growing provinces next year.
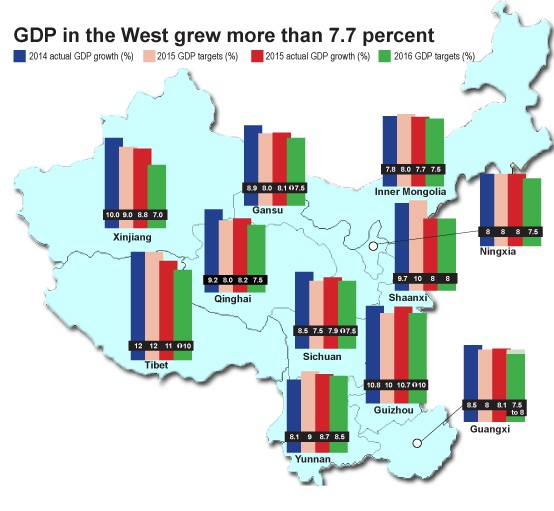
Core areas in the West
As Chinese policymakers promote western development, the growth rates of those provinces are not an obvious reflection of the headline-grabbing “slowdown.” Xinjiang, Shaanxi, Ningxia, Qinghai, Inner Mongolia, Guangxi, Yunnan, and Tibet grew more than 7.7 percent. These provinces have all been designated as core land-route areas of the One Belt One Road Initiative, with a focus on deepening ties to Central and South Asia. These provinces are also among the poorest and least-populated in China, lagging behind the more developed Eastern coast.
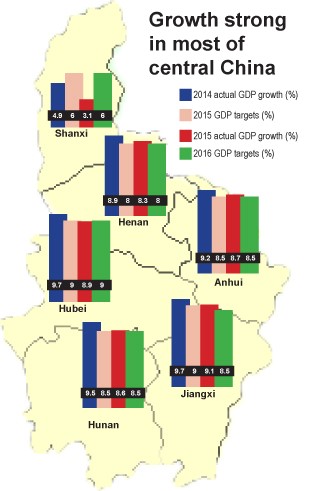
Central China
Six of the provinces in central China – Jiangxi, Hubei, Anhui, Hunan, Henan, and Shanxi – contribute about 20 percent to the national GDP, and account for 27.3 percent of the national population.
Unlike the southeastern coastal or western areas, these provinces are not known for high-profile support measures in the form of development schemes or pilot zones. Still, in 2015 five of the six provinces posted stable GDP growth of more than 8.3 percent, although one province – the heavily coal dependent Shanxi – only saw a growth rate of 3.1 percent.
Shanxi holds the distinction of being China’s largest coal mining province, and with all of the focus on supply side reform and economic restructuring, the province has been hit hard by attempts at industrial structural transformation aimed at reducing overcapacity. Annual GDP growth has declined by half since 2014, and in 2015 the debt accumulated by the seven major state-owned coal enterprises in the region ballooned to the size of the province’s entire GDP.
To offset this, the local government has been relying on fixed asset investment to stabilize growth; last year, local data indicates that the amount of fixed-asset investment surpassed local GDP and reached nearly 1.4 trillion RMB.
What does it mean?
Despite the national growth rate slowdown, what’s happening in Heilongjiang does not represent what’s happening in Sichuan, Guangdong, Fujian, or Shanghai. The economic situation in China varies by geography and sector, in ways that reflect the economic transition. Growth will vary by customer segment, too, with differences showing up between non-government and private sector growth vs. government and state-owned customers.
Overall, USCBC members report slowing revenue growth, in line with the moderating GDP growth. Indeed, recent news on China’s first quarter provincial GDP growth paints a darker picture than years past, especially as heavy industry reliant provinces like Liaoning post negative growth rates for the first time in seven years. But even at growth rates of 5 to 6 percent over the next decade, China will still add the equivalent of roughly two Germanies or four Indias to its economy.
The better question is whether American companies will be able to access China’s continuing growth as fully as they should, given the lingering market access barriers and level playing concerns. The USCBC board of directors’ Statement of Priorities in the US-China Commercial Relationship captures many of those concerns and sets the organization’s advocacy agenda throughout the year.