
The Chinese stock market opened 2016 in unprecedented turmoil, with “circuit breaking” in two trading days out of the week’s first four. CSRC suspended this mechanism late on the same day” better, resulting in only a temporary comeback, followed by a fresh fall. During the first two weeks of the new year, the Shanghai Composite Index fell by 18%, to its lowest level since August 2015. Together with a sharp fall of the renminbi vs the dollar, A share market caused a chain reaction across the world stock markets, with $ 2.3 trillion evaporating during the first week of the year. Pessimism about the Chinese economy spread in the world media. Maury Obstfeld, economic counsellor and director of research at the IMF, listed China as the first worry in 2016’s worldwide economic prospects, saying that “the global spillovers of China’s reduced rate of growth … have been much larger than we would have anticipated”.
The National Bureau of Statistics announced on Jan. 19 that China’s GDP grew by 6.9% in 2015, the lowest since 1990, with the last quarter of the year recorded only 6.8% annual rate. A number of economists doubt if the Chinese economy is actually running at even that rate, judging from the poor performances of the stock market and RMB depreciation, and the series of fresh poor data.
A number of recent economic indicators do show that the downward trend of the Chinese economy, after slowing downing for slowing quarters, is still continuing. The official manufacturing PMI for December 2015 stood at 49.7, lower than expected (49.8) and stayed stubbornly within the range of contraction. CPI for the whole year of 2015 was only 1.4% over a year ago, even closer to the danger of deflation. PPI, the producer price index, was off 5.9% over 2014, indicating clearly the difficulties in industrial production, faced with inadequate demand and over-capacity. Although the total added value of industrial output grew by 6.1% for the whole year of 2015, the nominal industrial revenue for the first 11 months barely managed a growth of 1% y-o-y.
As the Chinese government will focus on cutting down the over-capacity and excessive inventory, many economists believe that the downside trend will not only continue, but also intensify.
Chinese Stock Market Does Not Reflect Economic Fundamentals
The turbulent stock market since the start of 2016 has proved once again that the Chinese stock market, rather than being a reliable economic barometer, is basically independent of economic fundamentals. The Chinese stock market was one of the worst performers in the world stock markets in 2010-2013, although the Chinese economy was one of the best performers. In mid-June, 2014, however, it suddenly got excited and then underwent a booming period for 12 months. The Shanghai Composite Index rose from 2,051.71 on June 12, 2014 to 5,166.35 on June 12, 2015 — up 151.8% in exactly 365 days! During those 12 months, the economy followed a downside curve with GDP growth rate falling from Q4 of 2013. Then, the market tumbled to below 3,000 on Aug. 26, just two and half months later, only stabilized somewhat by the efforts of the CSRC.
The performances over the past few years, especially the last 19 months, have proved that the Chinese stock market has been increasingly deviating from the real economy, and instead, basically chasing the trajectory of fictitious economy. It has been driven by too frequent concept-making and short-term speculation. Hence, the overall scenario of the Chinese economy should not be based on the stock market moves, but on the fundamental indicators of the country’s economic health.
Supply-side Reform: De-Capacity and De-Stocking, a Balanced Assessment
The serious industrial over-capacity and high real estate inventory, and the government’s central task of de-capacity and de-stocking in 2016, have led to expectations of a drastic drop in GDP growth rate. However, if we examine all 41 industrial sectors, only eight are suffering from heavy over-capacity and negative growth. The newly emerging and high-tech industries, including computer, telecom and electronics, aerospace, railroad rolling stocks and pharmaceuticals are all performing well. The traditional industries, including food processing, textiles and apparel, furniture, leather goods, rubber and plastic products, and automobiles and parts, are also growing steadily. The latter two categories are apparently not suffering from heavy over-capacity. As the latest data for the whole year of 2015 is not yet available, the data below shows the first 11 months:
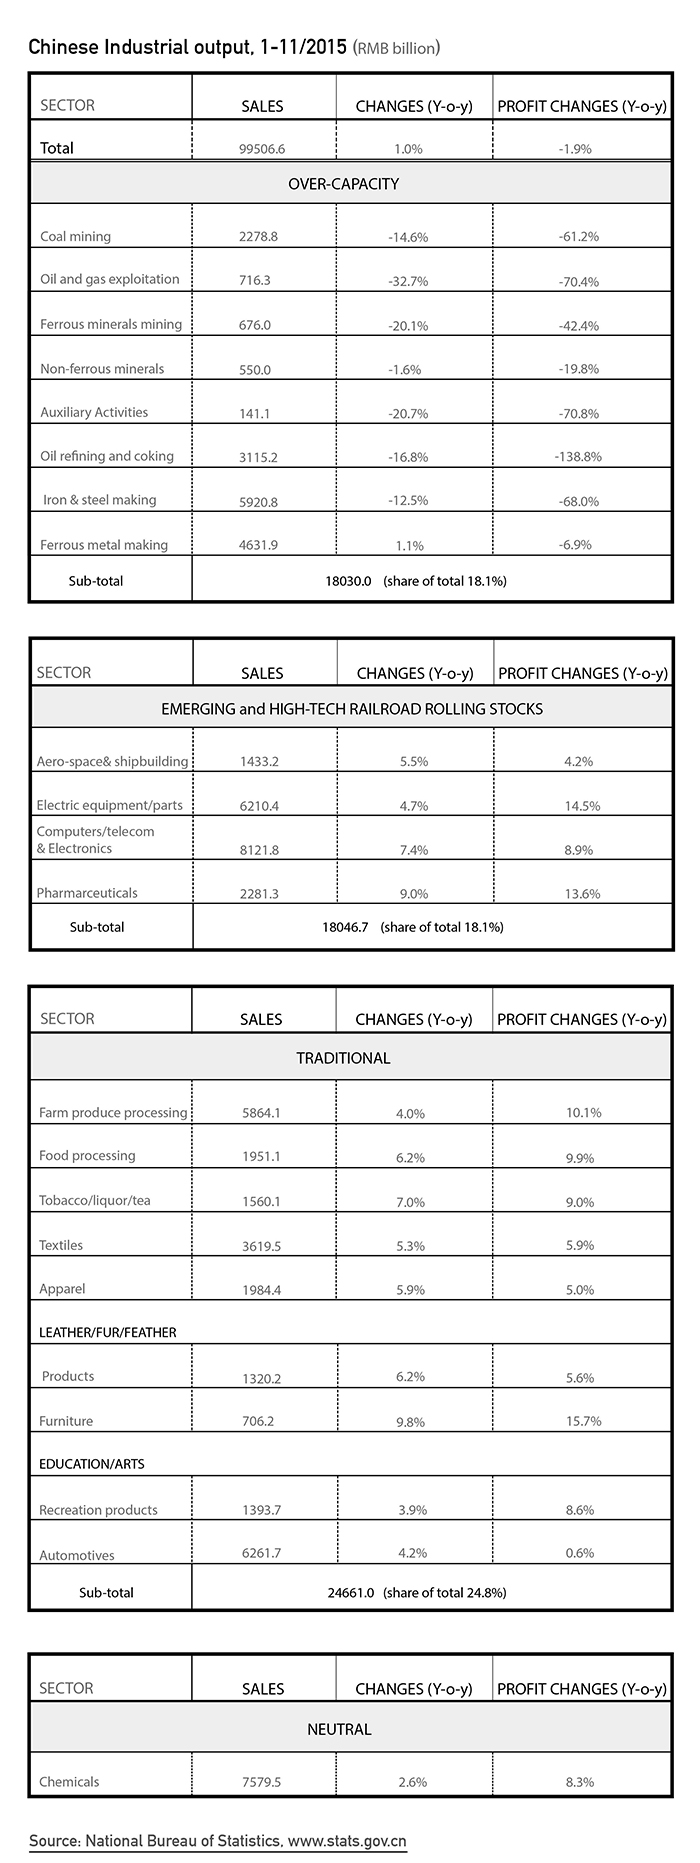
Due to the fall of PPI, the nominal growth rate of industrial sales grew only by 1%. The actual growth of added value was 6.2%.
The above table shows that eight sectors with serious overcapacity represent 18.1% of the total industrial output, and was exactly counter-weighted by well-performing four emerging and high-tech sectors (18.1%). Eight traditional sectors, 24.8% of the total, the largest share, are also growing steadily with sustainable profitability. Chemicals, which accounts for 7.6% of total industrial output, suffers minor over-capacity, performed neither well nor badly, but with sound profitability.
In balance, the effort to shrink capacity will only involve a minor part of the whole industry, and thus will likely not to bring down the whole industry growth. On the other hand, the emerging and high-tech sectors are likely to accelerate and thus lift the potential growth rate of all industry. The traditional sectors and chemicals will stay mostly stable. In balance, the industry growth as a whole will only be slightly slower in 2016, with no danger of a major slump.
In the tertiary sector, the supply-side reform will only accelerate the supply of public goods, including education, healthcare, recreation and telecom services. Among them, however, the real estate sector will see a major de-stocking, which will add uncertainty to the growth prospect. During the first three quarters of 2015, the real estate sector only contributed 0.04 percent point to GDP growth. Overall, growth rate in the tertiary sector could be slightly higher in 2016.
Taking the secondary and tertiary sectors together, we do not see any reason for a drastic growth rate fall in 2016.
Demand-Side: Consumption Remains Resilient
On the demand side, the contribution to GDP growth from consumption will tend to increase, while that from investment will continue to fall, and that from net exports remains unclear.
Consumption contributed 58.4% of GDP growth during the first three quarters of 2015, or pulling GDP growth by 4.0 percentage points. Many economists tend to worry that the consumption rate in China, now over 50%, is still considerably lower than in developed countries at 60-70% contribution to GDP. This argument needs further discussion, as there are different approaches. In the case of the US, the sales volume of retail, healthcare, education, housing, recreation and business services combined accounts for over 70% of GDP. If we take the same approach for China, the consumption rate would have been much higher.
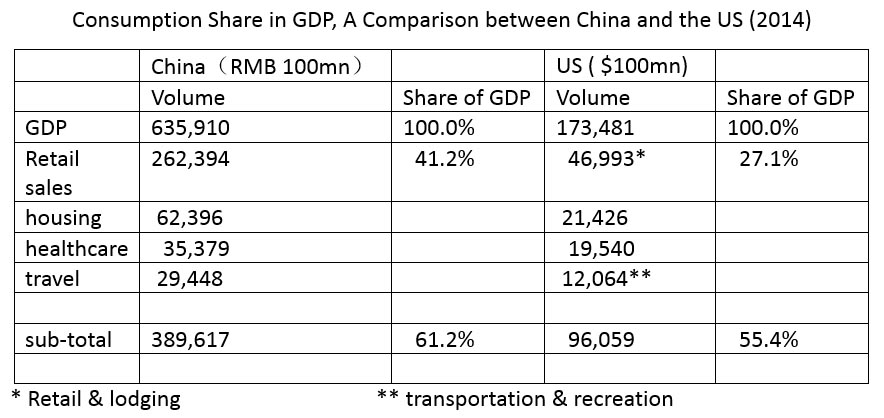
Source: National Bureau of Statistics, Commission of Health and Family Planning, State Bureau of Tourism, Bureau of Economic Analysis of USDOC, and computed thereof.
Total sales of consumption goods in China had a higher share in GDP than that in the US. As retail sales, on-line shopping, travel and tourism, cultural and telecom consumption are all growing steadily, we don’t see any drastic slowdown. Consumption contributed 3.7% to GDP growth both in 2013 and 2014, and 4.0 in the first three quarters of 2015. It is thus estimated that it will likely contribute 3.50-4.0% to GDP growth in 2016.
Fixed investment has a falling contribution to GDP growth over recent years. Its net contribution to GDP growth fell to 3.0% during the first three quarters of 2015, as compared to 3.6 in 2014 and 4.2 in 2013. 2016 will most likely see its contribution under 3.0 pct.
China saw a big jump of 56.7% in its trade-in-goods surplus in 2015, only partially offset by the growth of trade-in-services deficit. In 2016, the world commodity and oil market will not see a fundamental improvement, and thus the Chinese trade pattern will remain similar to that of 2015. It also means that net exports could also contribute positively to China’s GDP growth rate.
In short, the downward trend in China’s economy will continue for some time in 2016, and the overall growth rate will be even lower than in 2015. On the other side, the economic fundamentals justify predicting a steady growth rate of 6.5-6.8%, depending on the progress of the reforms and restructuring, and on the developments of world economic situation. In any event, a major slump, or “hard landing”, seems out of the question.