

Recently the National Bureau of Statistics of China (NBSC) reported a rate of growth of real GDP of 6.9% for 2017, a slight increase from the 6.7% in 2016, and higher than the target rate of growth for the year. This announcement was welcome by much of the world as a sign that China finally and successfully transitioned to its “new normal”. However, it was also met with the usual skepticism in some quarters, especially because of the recent voluntary revelations by, respectively, the Inner Mongolia Autonomous Region, the Province of Liaoning, and the Binhai District of the Municipality of Tianjin, that they had been over-stating their economic data in the past.
Yet, the fact that the NBSC did not take the provincial, regional or municipal statistics at their face values is quite well known. Its estimates of the national GDP do not rely solely on the local estimates. If one compares the GDP-weighted average annual rate of growth of provincial GDPs and the annual rate of growth of the national GDP, all published in the annual China Statistical Yearbook, one finds that since 1993, the weighted average rate has been consistently higher than the national rate by a couple of percentage points, except for the year 2007 (see Chart 1). If one uses quarterly data, which are available since 2005, a similar picture emerges (see Chart 2). These charts show conclusively that the NBSC has always tried to adjust the local data before producing the national estimates.
Chart 1: A Comparison of the Weighted Average Provincial and National Annual Rates of Economic Growth
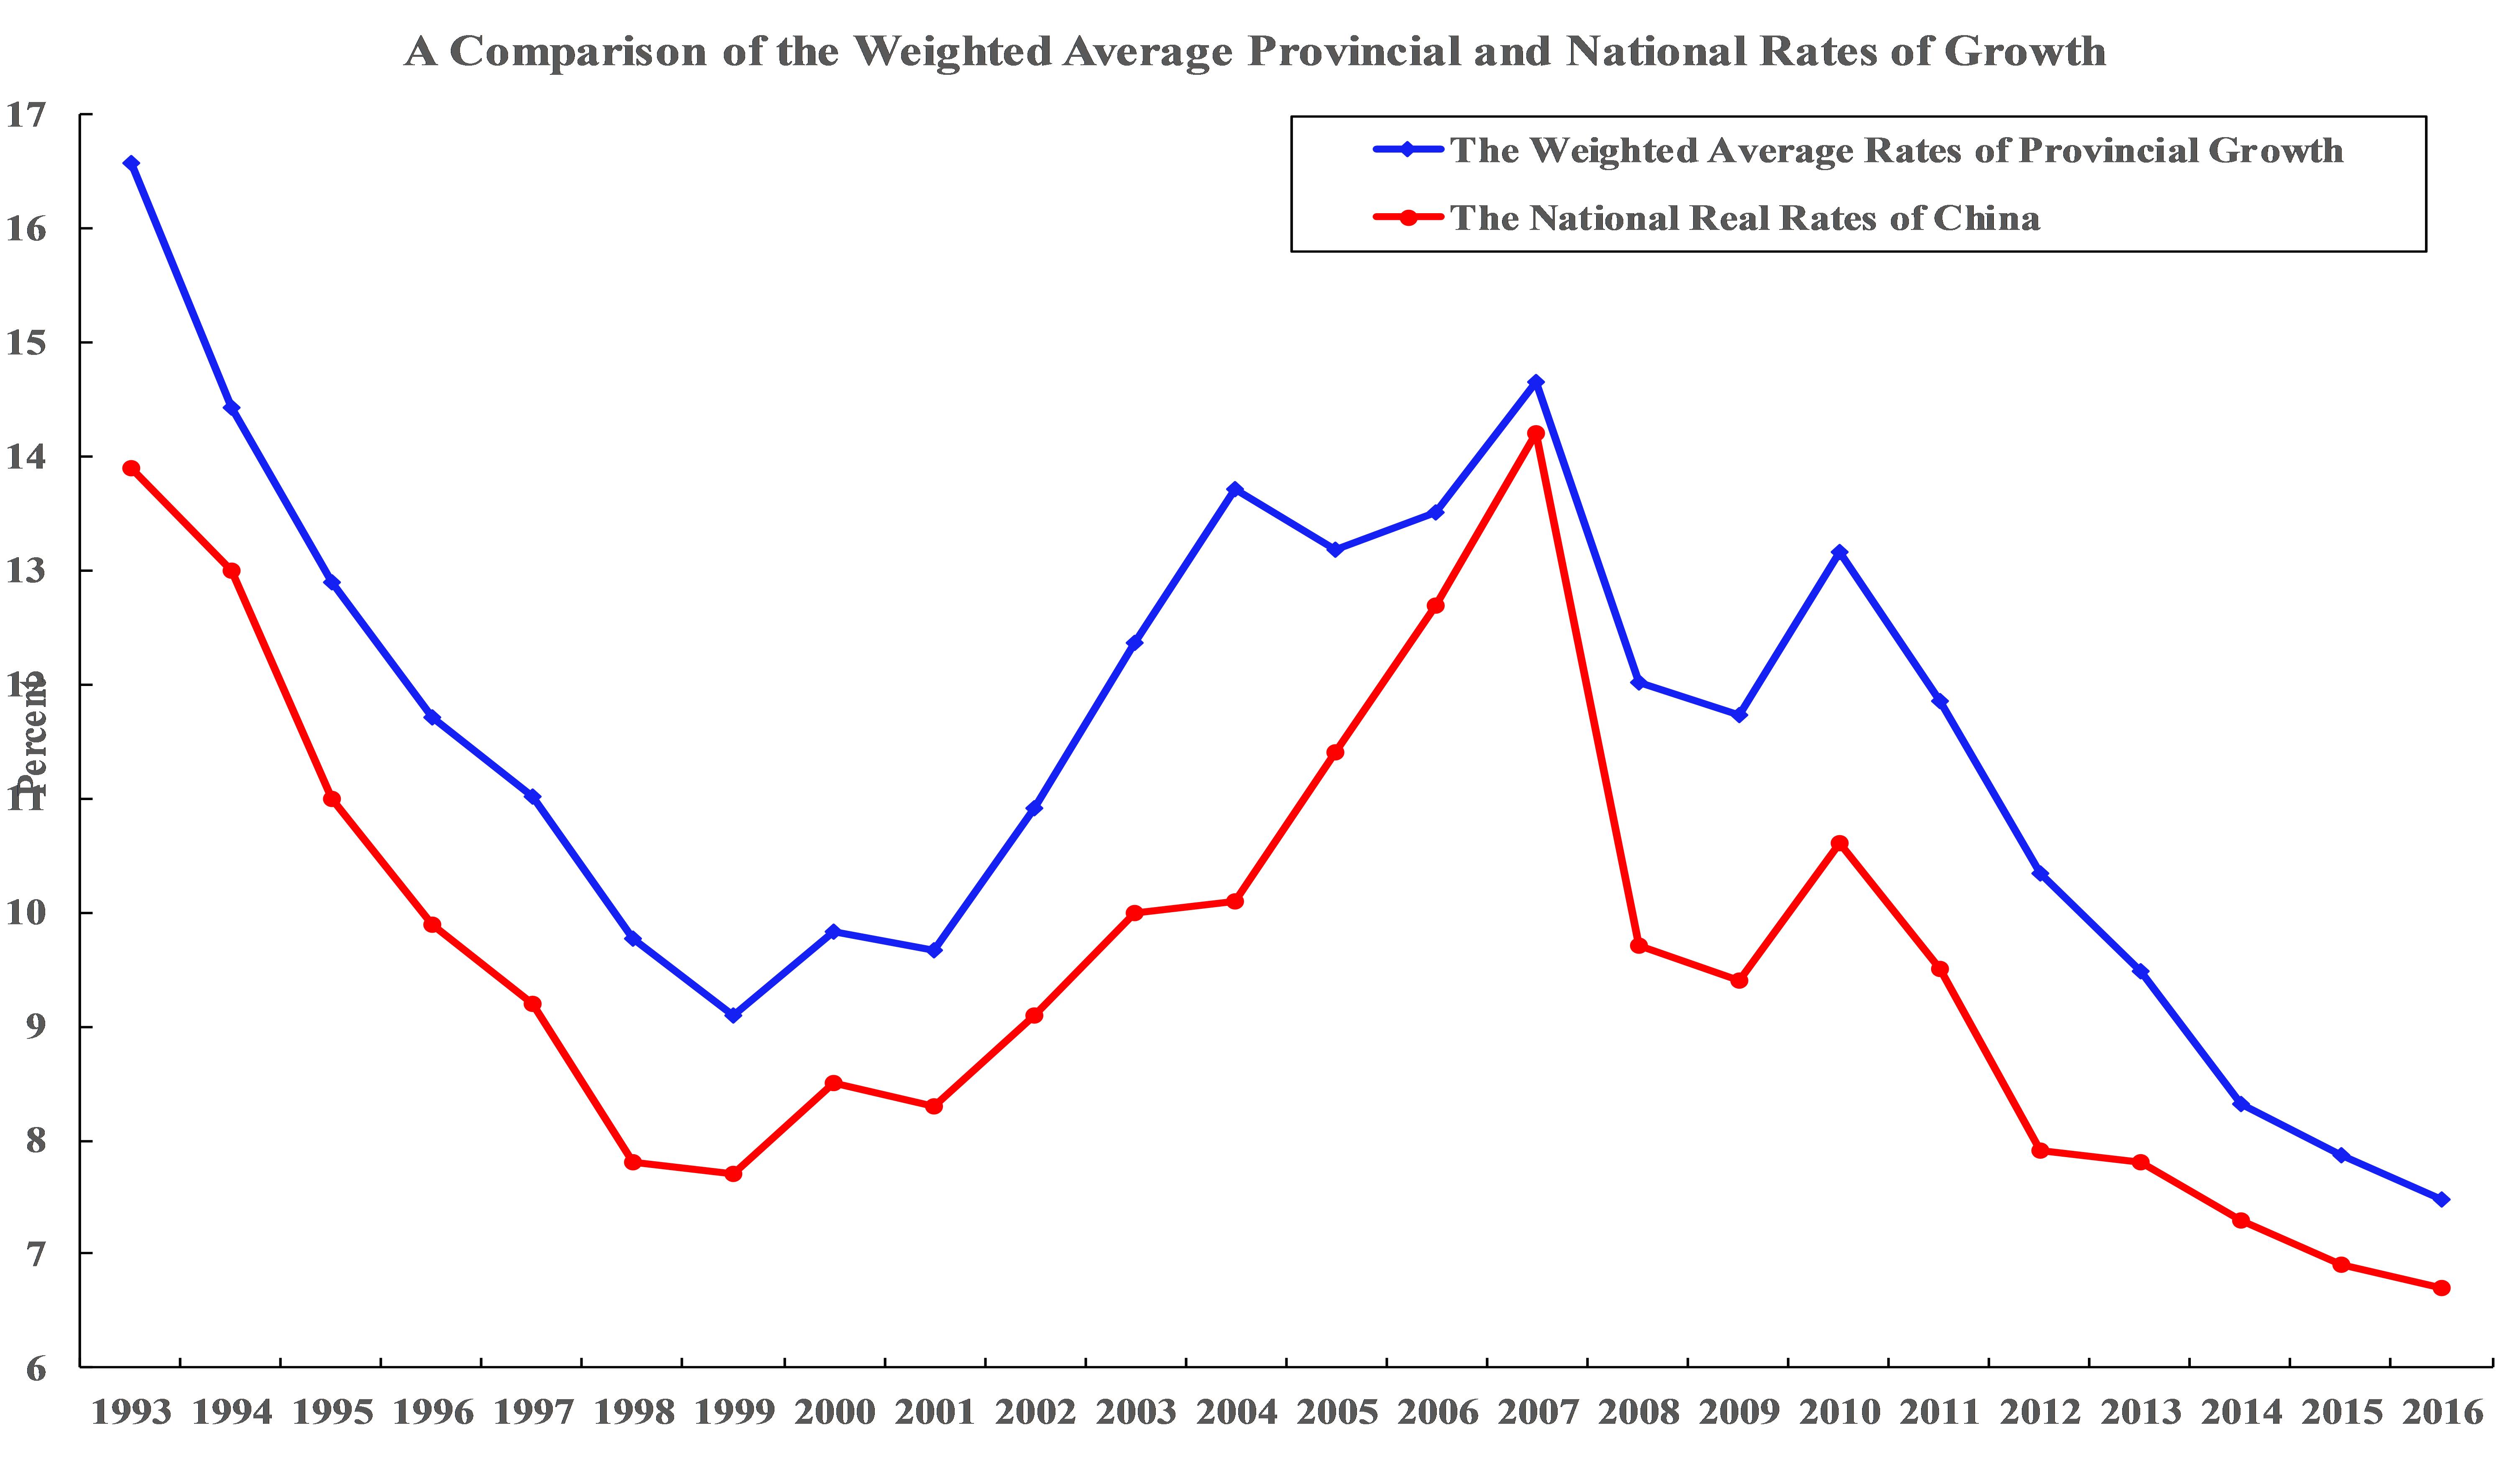
Source: http://www.stats.gov.cn/tjsj/zxfb/201801/t20180119_1575351.html
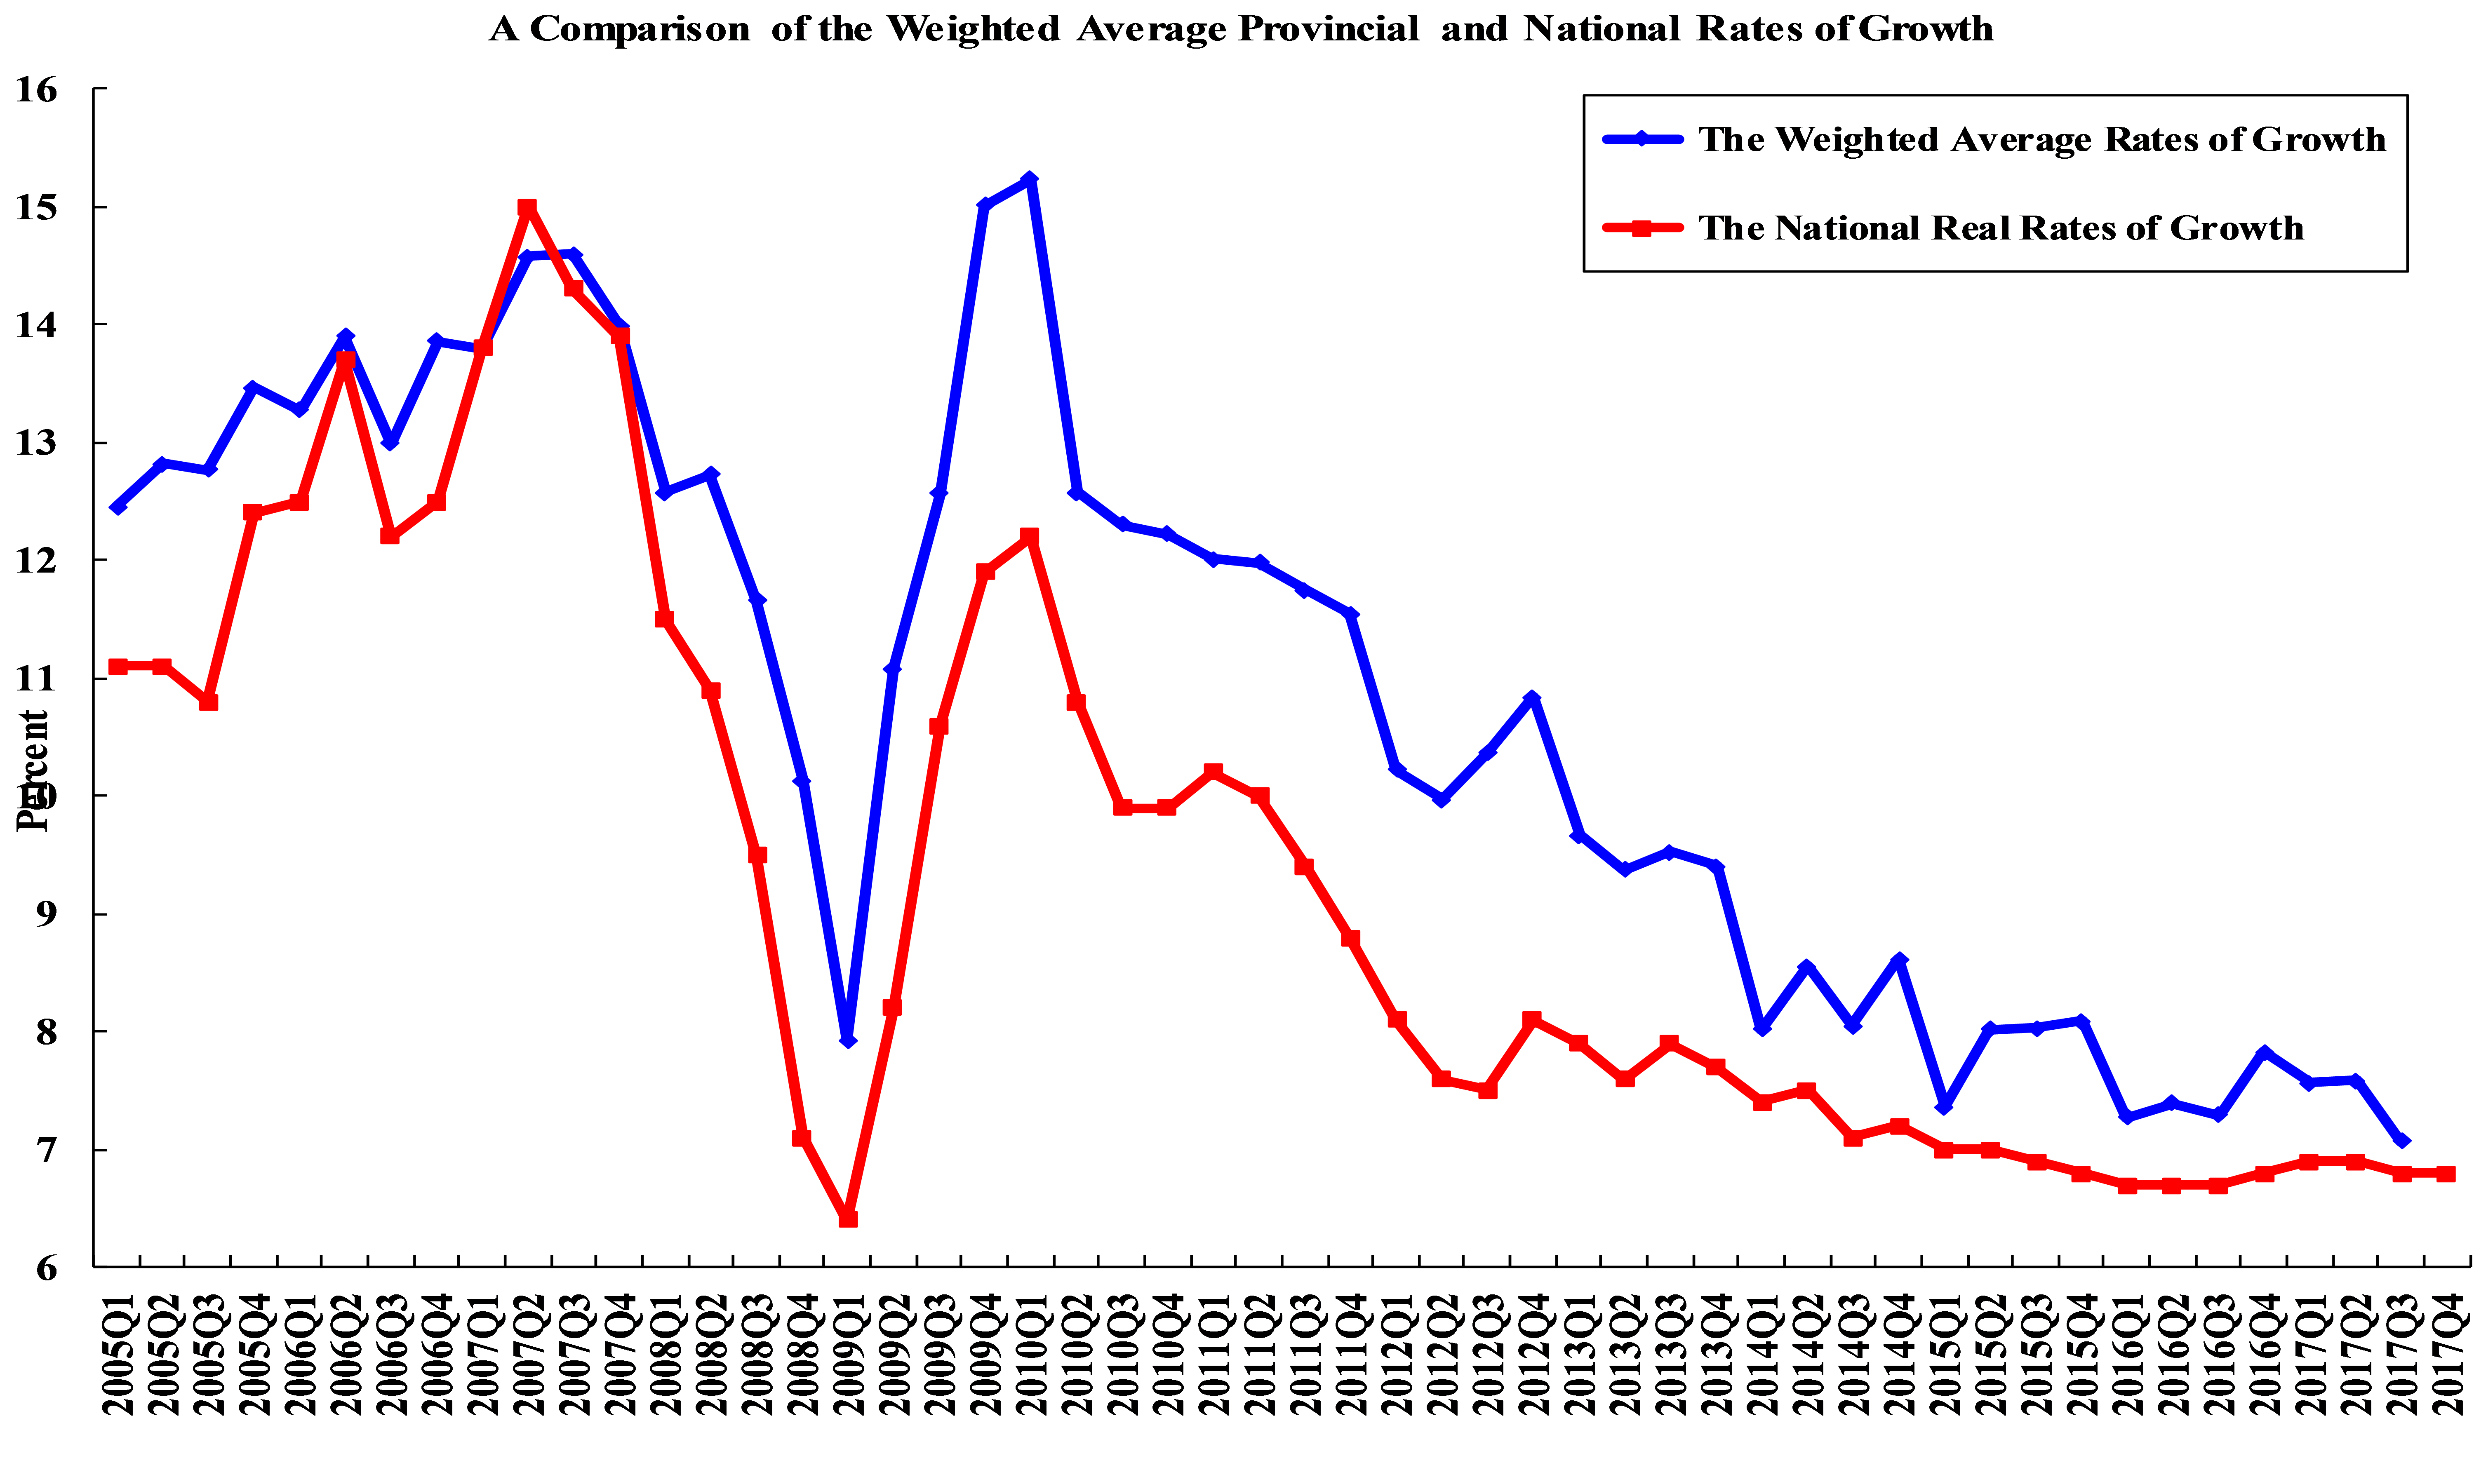
Source: http://www.stats.gov.cn/tjsj/zxfb/201801/t20180119_1575351.html
The consistent discrepancies between the weighted average provincial and the national rates of growth indicate that the local data are not reliable and probably falsified. What are the incentives for the falsification of data, upwards or downwards, at the local level? For an up-and-coming local party secretary, the rate of growth of local GDP is a key performance indicator. If he or she would like to be promoted, he or she would have to be able to report a high rate of growth. However, for an official at or near the end of the career, for example, because of age limit, he or she might not want to overstate the economic results but instead would understate the results so as to lower the locality’s contribution of revenue to the central government and to retain more resources for the locality, where he or she might spend the retirement years. Thus, the “falsification” can occur in both directions.
One may also speculate why these revelations occurred precisely at this juncture. One interpretation is that this is the year in which all the top local officials are being replaced. So it makes sense for the new appointee to come clean, so that he or she can start with a low base from which to measure the growth. There is of course the risk that the predecessor might be offended. However, if the predecessor is already in trouble for other reasons, for example, with past corruption, there is no downside to blame everything on him or her. This strategy is not much different from a newly arrived CEO at a firm taking a big write-off so that it is easier for him or her to look good later.
Having said the above, it is also worth pointing out that provincial GDPs are in fact notoriously difficult to measure, just like state GDPs in the U.S., because there is no customs control across provincial or state borders. The net exports of a province or a state is therefore extremely difficult ascertain because there is no real reporting requirements of inter-provincial or interstate trade.
While there are incentives for local officials to falsify the economic data, there is actually little real incentive for the central government to falsify the data. In fact, as the lesson of the Great Leap Forward illustrates, false data might actually lead to the wrong policy decisions. There is no evidence of a systematic falsification of data, either upwards or downwards, at the central government level, since economic reform began in China in 1978. There may be inaccuracies, omissions and fraudulent reporting (for example, over- or under-invoicing of exports or imports), but no intentional falsification of data. Falsifying publicly distributed data provides the wrong signals to enterprises, households and governments of all levels. The biggest risk is for people to thank that the rate of growth is 8% when it is actually 4%, or vice versa. Acting on the wrong information can do enormous damage to the economy. There is no benefit to China whatsoever to falsify the economic data. And the Chinese economy can easily survive a rate of growth lower than 6%. Falsification of data risks not only confusing one’s enemies and competitors but also one’s own allies, friends and colleagues.
Some observer points to the smoothness of the Chinese growth data as proof of falsification. There is no accepted criterion of when data should be considered too smooth. However, aggregating over a large and diverse geographical area such as China inevitably results in reasonably smooth data because the outliers are averaged out. Smooth data can also be the outcome of successful macroeconomic management rather than falsification.
Finally, another frequently mentioned reason for skepticism is based on the “Keqiang Index”, named after current Chinese Premier LI Keqiang. (However, it must be added that the index itself is not Premier LI’s creation.) The index, constructed by some Chinese economy watchers, tries to mimic the rate of growth of Chinese real GDP by taking a weighted average of the rates of growth of railway cargo volume, electricity consumption and loans disbursed by banks. These were reportedly the preferred macroeconomic performance indicators of Premier LI when he served as the Party Secretary of Liaoning, as he supposedly told a U.S. diplomat in a private conversation in 2007, according to WikiLeaks. However, the index has not tracked the Chinese economy well in recent years because the service sector has become the most important sector as well as the fastest-growing sector in the economy. In 2017, the distribution of Chinese GDP by production sectors was approximately: Primary (agriculture), 7.9%; Secondary (manufacturing, mining and construction), 40.5%; and Tertiary (services), 51.6%. Since the service sector does not require much fixed assets investment, in particular, not much machinery and equipment, it does not need to consume much electricity or require much cargo shipment to generate its GDP. Its working capital requirements are also relatively low since inventory is minimal. Moreover, the Chinese industrial sector has also begun to become more energy-efficient over time. Thus, the rate of growth of electricity consumption is no longer a good indicator of the rate of growth of industrial production as it does not take into account the increased energy efficiency of the new production capacities. Projections based on the “Keqiang Index” are therefore likely to understate the rate of growth of Chinese real GDP.
In conclusion, even though Chinese economic statistics are far from perfect, they are the most reliable data available, and there is no evidence of intentional or systematic falsification by NBSC.


