
Since the start of August, the stock-market plunge, the RMB’s moderate devaluation against the dollar, and the recent weak economic data have led to mounting pessimism about the Chinese economy in the world. Some experts and media ascribed the global market’s panic to the Chinese stock-market plunge and the continuous deprecation in many emerging-market currencies to RMB devaluation. A prevailing saying goes that “When China sneezes, the world catches cold.” Highlighting the new concern, an article in the Financial Times in late August even asked if “The China Age” is over.

The Federal Reserve Bank decided not to raise interest rates on Sept 17, based partly on the international financial situation including the China factor.
However, other developments during the first half of September have provided more food for thought. There has been a mild stabilization and even a pick-up in the U.S. and European stock markets, although the Chinese stock market has been wavering. The RMB-dollar exchange rate has remained remarkably stable after 4% depreciation in mid-August.
A closer look at the fundamentals of the Chinese economy will provide some new perspective.
The Chinese Stock-Market Plunge Does Not Reflect the Economic Fundamentals
People tend to raise alarms about the Chinese stock plunge from its June peak, but few mention the sharp rise that preceded it. The Shanghai composite index barely stood at 3,005 on September 15, 41.8% down from its peak of 5,166.35 on June 12th. However, exactly 12 months earlier, the index was only 2,051.71 (June 12, 2014). There was a frenzied rise of 151.8% over the previous 12 months! Media in the West even neglected it — only mentioning that $5 trillion evaporated in the world stock markets in August. They even failed to mention that $4 trillion evaporated in Chinese stock markets alone. Nonetheless, it was only out of the $6 trillion that was added during the previous 12 months’ dramatic rise. At 3,005, the market was still 46.4% up over the last 15 months.
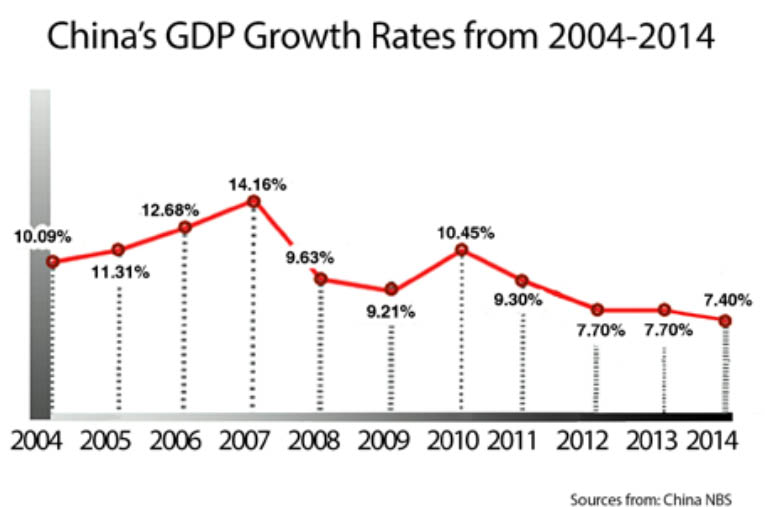
The mad, irrational stock boom during the 12 months before June 2015 had led to an exceptionally high PE (90.42 on average), or serious bubble, that could only end in a bust. However, during the whole 15 months of boom and bust, the macro economic data kept sliding. GDP growth decelerated from 7.5% in H1, 2014, to 7.4% in H2, 2014, and to 7.0% in H2, 2015 (Note: Downside trend is more obvious even during the stock boom). Hence, the stock-market index’s sharp fall does not indicate any big trouble in the Chinese macro economy, although both irrational booms and sudden busts are damaging.
6-7% Growth in China Achievable
The continuing downside trend in the Chinese economy has been caused by the changes in three basic driving forces: consumption, fixed investment, and net exports, with investment playing an increasingly weaker role and net exports dwindling.
The double-digit economic growth before 2011 was primarily pushed by heavy investment, which contributed 7.0 percentage points to the GDP growth of 10.6% in 2010. During that year, the investment ratio (fixed investment volume as a percentage of GDP) was 61.8%. Since then, the ratio has kept rising, hitting 76.5% in 2013 and 80.8% in 2014. However, it contributed only 4.2 percentage points to GDP growth in 2013 and only 3.6 percentage points in 2014. During the first half of 2015, the ratio was slightly higher than in 2014, but contributed less than 3 percentage points. Why? The declining efficiency or fringe benefit due to excess investment. Therefore, investment’s contribution to GDP has shed 2-3 percentage points.
Net exports, which normally contributed 1-2 percentage points to GDP growth during the double-digit growth period, have made roughly zero contribution over the recent years.
As a result, the only leading force driving GDP growth is consumption, which has remained stable, contributing 3.7, 3.7, and 4.2 percentage points to GDP growth in 2013, 2014, and H1 of 2015.
It can be expected that consumption will contribute a stable 4 percentage points to GDP growth over the next few years. Investment, due to its huge size and more efficient investment from the private sector, could contribute at least 2 percentage points to GDP growth. Assuming that net exports will continue to make zero contribution, total GDP growth rate will be above 6%, which is considerably higher than any range of “hard landing” ( GDP growth rate under 4%), and will remain a medium-high growth rate among all the world leading economies.
Dr. Simon Baptist, chief economist of the Economist Intelligence Unit (EIU), estimated on Sept 10 that total world GDP will add $2,159.6 billion in 2016, with China contributing $ 901 billion, accounting for 41.7% of world economic growth, and the U.S. contributing $619 billion, accounting for 30.5%. China will still make the largest contribution to world economic growth.
China is Not the Fundamental Reason for the American Stock Market Fall
“China shock” did influence the U.S. and European stock markets last month. However, the repercussion was mostly psychological and temporary: With time passing by, their own market fundamentals dominate. During the first half of September, the U.S. and European markets have been rising steadily, although the Chinese stock markets are still struggling.
First, the Chinese and American stock markets have followed different trajectories. The Chinese stock market plunge started in mid-June, with the Shanghai composite index breaking the 4,000 barrier on July 25 (falling from 5,166.35 on June 12). The Dow Jones Industrial Average, on the other hand, remained resilient at 17,690.46 on July 31, marginally lower from 18,010.68 on May 29. It started slumping from Aug 20, more than two months later. The Shanghai composite index fell below 3,000 on Aug 25, and has hovered around that level ever since. The DJIA, however, after hitting 15,370, recovered gradually. On Sept 17, it closed at 16,774.74, 9.1% up from the low.
Second, the American stock market has its own bubbles. Above 18,000, DJIA was approximately 40% higher than it was at the end of 2012, while actual GDP had grown by 7% during this period. Studies show that S&P 500 PE was already 27.2 by early August, compared to the historic average of 16.6. S&P 500 PE was only higher in 1929, 2000 and 2007, all followed with a stock plunge. Professor Robert Schiller of Yale University, a Nobel laureate, said recently that his study had found apparent stock bubbles. Mr. Wolfgang Schauble, the German finance minister, made a similar warning on Sept 11.
Third, the prospect of a Fed rate hike, pending but undated, was enough to cap the stock market. On Oct 19, 1987, when new Fed chairman Alan Greenspan raised the federal rate by a drastic 2%, the stock market crashed immediately, with the DJIA falling by 22.5% in a single trading day, known as “Black Monday”. Nonetheless, the real economy was not that hurt. GDP in 1987 grew by 3.5% that year and accelerated to 4.2% in 1988. The recent US stock-market fall was actually a gradual response and pre-digestion of the pending Fed rate hike. The Fed decided on Sept 17 not to raise the federal rate, thus giving the market further breathing room. However, the initial response was a slight fall before closing, because the decision aggravated the market’s pessimistic sentiment on the economy.
Dollar Strength, Not “Currency War”
The moderate depreciation of RMB to the dollar that started on Aug 11 lasted only three trading days, with a slight rebound since then, resulting in a net 3.7% fall. However, the RMB only depreciated against the dollar, not a basket of major currencies. The basic reason for the depreciation is apparently the dollar’s strength.
Before Aug 11, major Asian currencies had already depreciated drastically to the dollar. According to a recent EIU study, during the 12 months prior to July, the Australian dollar fell by 16% to the dollar, the Japanese yen fell by 15%, followed by the currencies of New Zealand ( -12%), Malaysia ( -11%), Myanmar (-10%), Indonesia ( -9%), Singapore (-7%), South Korea(-5%), India and Vietnam ( -4% each), Sri Lanka, Thailand, Taiwan ( -2% each), the Philippines and Cambodia ( -1% each). Only the RMB and the Hong Kong dollar remained unchanged against the US dollar. During the same period, the RMB appreciated by 19% to the euro. Therefore, the RMB is still stronger than most other Asian currencies along with the euro, even after the recent depreciation.
During the month from Aug 14 to Sept 11, while the RMB rose slightly against the dollar, most other Asian currencies’ and the Brazilian real’s depreciation accelerated. The Indian rupee fell by 2.1%, almost the same as from Aug 11-14 (off 2.0%). The Brazilian real fell by 11.9% (up 0.2%). The Malaysia ringgit fell by 5.8% (off 3.9%). The South African rand fell by 6.4% (off 1.3%). On September 17th, when the Fed decided not to raise the interest rate, the emerging economies’ currencies immediately rose to the dollar. Again, it shows that the basic reason for their fall has been the dollar’s strength, instead of the RMB’s slide. No currency war has been triggered by China.
Emerging Economies’ Difficulties Should be Addressed Globally
As China’s import demand has been contracting, China has been repeatedly blamed for the world commodity prices’ fall and economic difficulties by a number of resource-dependent emerging economies. This is not true.
According to China’s official customs data, the value of Chinese imports fell by 14.3% over a year ago, or a net fall of $ 185.88 billion. The largest fall came from crude oil, off $ 62.52 billion, or 33.6% of the total fall. Import quantity of crude oil, actually increased by 9.8% over a year ago, reaching 220.67 million tons. The only reason behind the sharp fall in oil import value is the world oil price plunge, apparently not caused by China. Iron ore’s import value also fell by $ 29.17 billion. However, there was virtually no fall in import quantity (off 0.2%). Zambia, with 70% of foreign-exchange income depending on copper-ore export, is currently in serious difficulty as the world copper price keeps slumping. China, on the other hand, increased its copper-ore imports by 12% during the first eight months of the year. Again, China is not the primary reason for the world copper-price fall.
The continuous fall in world energy and commodities is a global phenomenon that should be addressed by concerted efforts of all countries. With an expected mild rebound by the end of the year and beyond, it is likely that China’s imports will gradually pick up, thus contributing more to the world commodities demand recovery.