
The Definition of a Public Good
In economics, a public good is usually defined as a product or service that is openly available to be enjoyed by all members of a society. The Encyclopaedia Britannica defines a public good to be a product or service that is non-excludable and non-depletable (or “non-rivalrous”). Examples of such public goods include law enforcement, national defence, a stable local currency, and clean air and water. The elimination of a public bad, such as air pollution, is also a public good. The definition of a “public good” used in this article is slightly generalised to include potentially rivalrous goods, such as a seat on a train, so long as it is non-excludable ex ante. Basic education is a public good that is generally non-rivalrous; whereas mass transit is a public good that can at times be rivalrous.
Typically, these goods and services are administered and/or provided by central or local governments and paid for collectively through taxation. Public goods are unlikely to be supplied in sufficient quantities to satisfy potential demand through the free market because they are frequently “money-losers”. Public goods provision may therefore require taxes, subsidies, or even direct government intervention. A public good often faces the “free-rider” problem, that is, someone who is happy to enjoy the good or service, but will try to avoid bearing the cost. Food is normally a private good, but the provision of food security is a public good. Personal insurance is a private good. But a social safety net is a public good, as is the alleviation of poverty. Infrastructure is a (local) public good. Goods that generate externalities, e.g., mandatory basic education and the simplification of Chinese characters goods that provide a benefit for the society as a whole, are public goods.
The Possible Roles of Public Goods
China has done a relatively good job in the provision of public goods to its people, as will be shown below. The provision of these public goods has in turn enhanced the real rate of growth of the Chinese economy in various ways. Public goods provision mandates both capital and current expenditures and hence increases aggregate demand. They include, for example, fire and police protection, environmental preservation, protection and restoration, and the maintenance of blue skies, green mountains, and turquoise waters. These current expenditures can become part of an important component of the aggregate demand for government consumption. The capital expenditures such as those on infrastructure (communication, transportation and power), and the building of schools, hospitals and charging stations for electric cars, can also become a part of an important component of the aggregate demand for fixed-assets investment.
Moreover, the provision of many public goods such as education, public health and basic research can also be considered intangible investments even though they are often expensed on a current basis. A stable currency (money), in terms of purchasing power, is also a public good. The regulation of the markets so that they remain competitive and free of monopolistic influences is also a public good. Finally, maintaining public confidence and creating positive expectations of the future are also important public goods.
Public Goods Provision as Intangible Investment
Literacy
Traditionally, for at least a couple of millennia, the Chinese people have always valued education highly, in large part because it was one of the very few channels for upward social mobility. In the social hierarchy of old China, up to the early Twentieth Century, scholars were on the very top, followed by farmers, and then by laborers, with the merchants at the very bottom. Being wealthy alone did not improve social status or earn respect.
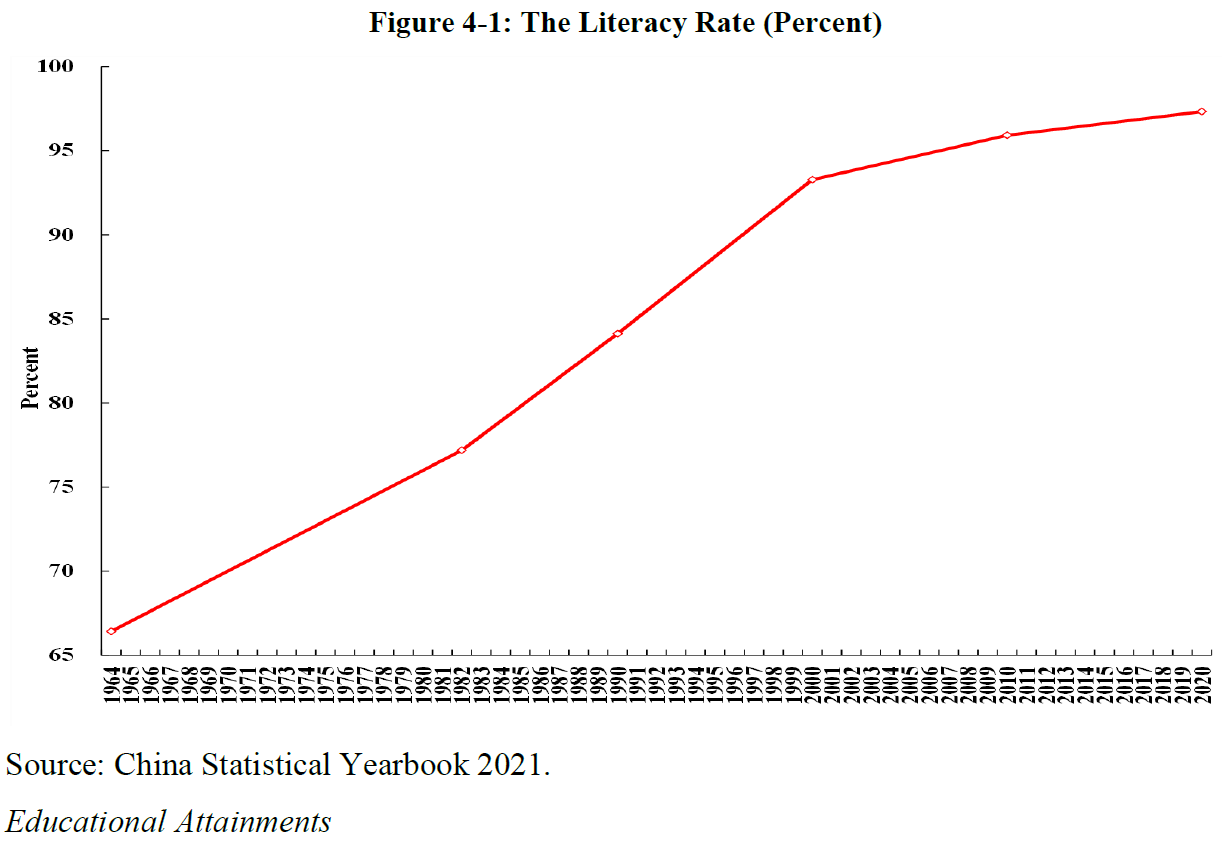
More generally, literacy and the promotion of Putonghua are clearly public goods because they enable all Chinese people to communicate with one another in both speech and writing. The literacy rate, which must have been way below 50% in 1949, increased from 66.4% in 1964 to 97.3% in 2020 (see Figure 4-1), thanks in part to the simplification of the Chinese characters undertaken in the 1950s and codified in 1964. The simplification has been subject to much criticism, some quite justifiable, but it did reduce the number of years of schooling required for an average person to be able to read a newspaper from eight to four years, a major accomplishment.
Educational Attainments
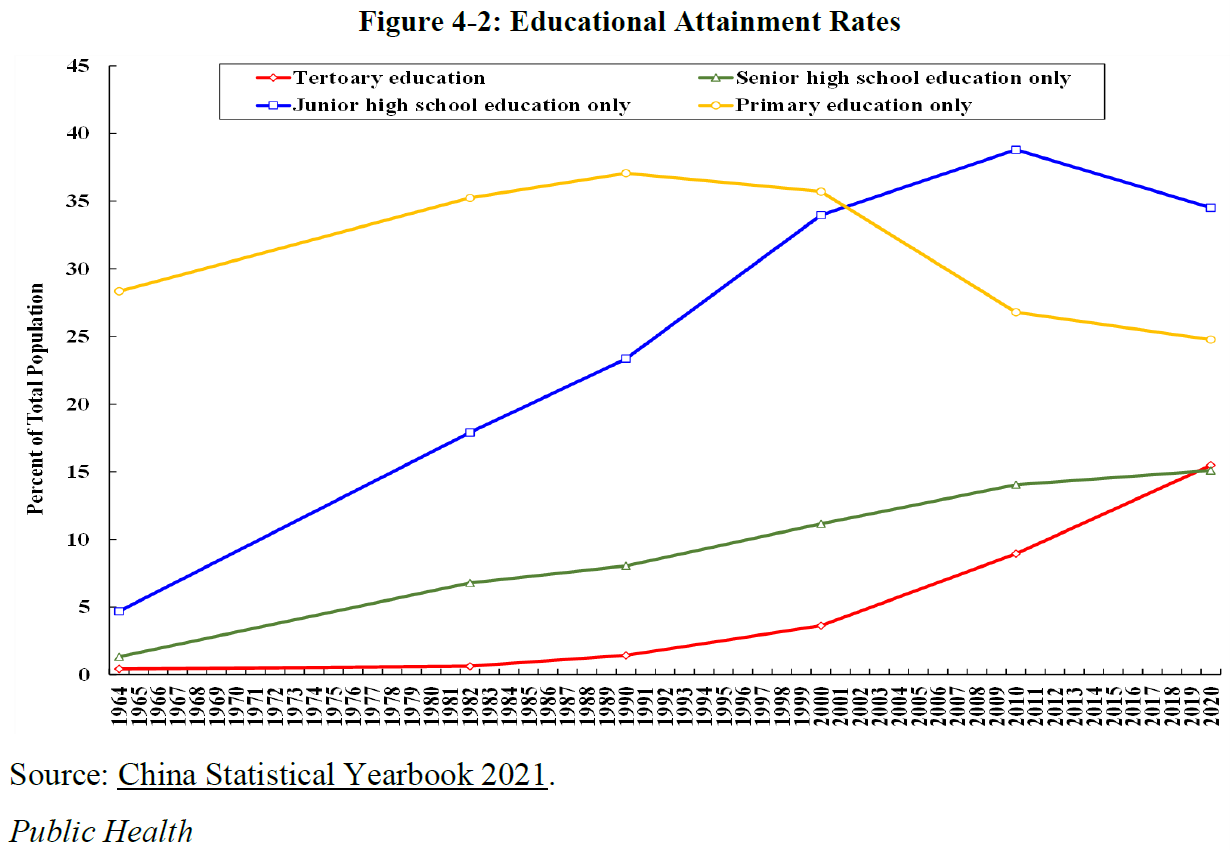
Mandatory nine-year education for all was introduced in China in 1986. Today, most young people have had at least 12 years of education, even though senior secondary education is still not yet mandatory at this time. The proportions of people with only primary education (the yellow line) or junior secondary education (the blue line) have already peaked and begun to decline (see Figure 4-2). The tertiary enrolment rate of graduates of senior secondary schools was 24.6% in 1989 and rose to 94.5% in 2016. This means almost everyone who wishes to attend a tertiary educational institution is now able to do so. (However, the proportion of the population aged 18-22 that were enrolled in tertiary education institutions in 2021 was only 57.8%, because not everyone in that age cohort had completed senior secondary school.) The proportion of the total population with tertiary education (the red line), which was only 0.42% in 1964, rose to 17% in 2021, and is expected to increase further with time.[1]
Public Health
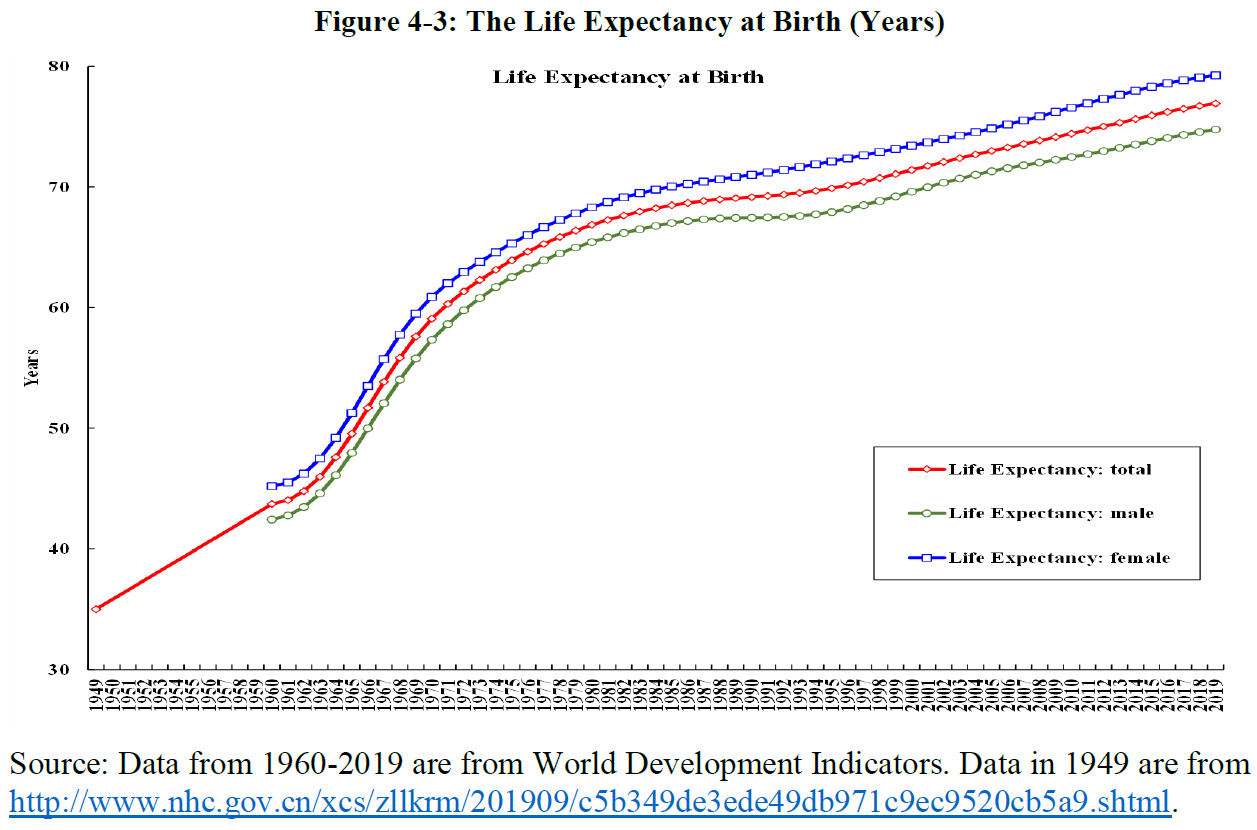
Much improvement has also occurred in healthcare and public hygiene in China. As mentioned above, the population mortality rate declined by more than half from 2.0% in 1949 to 0.72% in 2021. Life expectancy at birth, which was only 35 years in 1949 and 67.8 years in 1981, grew to 77.3 years in 2019 (see Figure 4-3), compared to 72.6 years for the world as a whole. Life expectancy at age 60 was 20.21 years in 2020.
The management of the COVID-19 epidemic in China must be considered quite successful. As of 22 April 2022, the COVID-19 epidemic infected 180,982 persons (excluding imported cases) and resulted in 4,686 deaths on the Mainland, with a quarter of the world’s population. By comparison, the rest of the world had, on the same date, a cumulative total of more than 508 million (508,526,800) infected cases and more than 6.2 million (6,235,952) fatalities. The recent surges in COVID-19 cases in China appeared to have come under control. The potential reduction in 2022 GDP due to the COVID-19 epidemic may be estimated to be between 0.5 and 1 percent.
Innovation
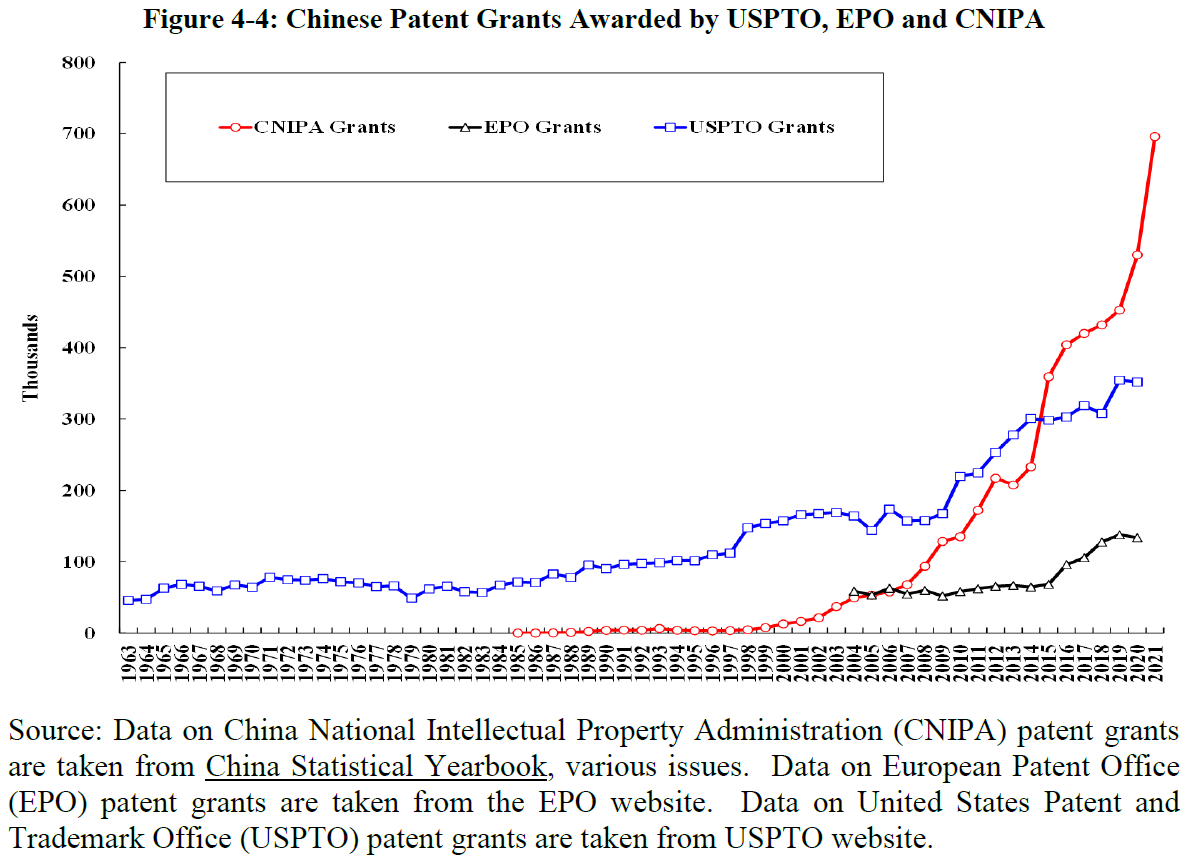
China has been increasing its investment in research and development (R&D), which reached 2.44% of GDP in 2021. Since 2014, it has also strengthened intellectual property right protection significantly by establishing special intellectual property courts with sole nationwide jurisdiction on such matters. The numbers of patents awarded to Chinese discoverers and inventors by respectively the United States Patent and Trademark Office (USPTO) (blue line), the European Patent Office (EPO) (black line), and the China National Intellectual Property Administration (CNIPA) (red line), have all been increasing by leaps and bounds in recent years (see Figure 4-4). China is now the recipient of the largest number of patent grants in the world from these three patent offices combined.
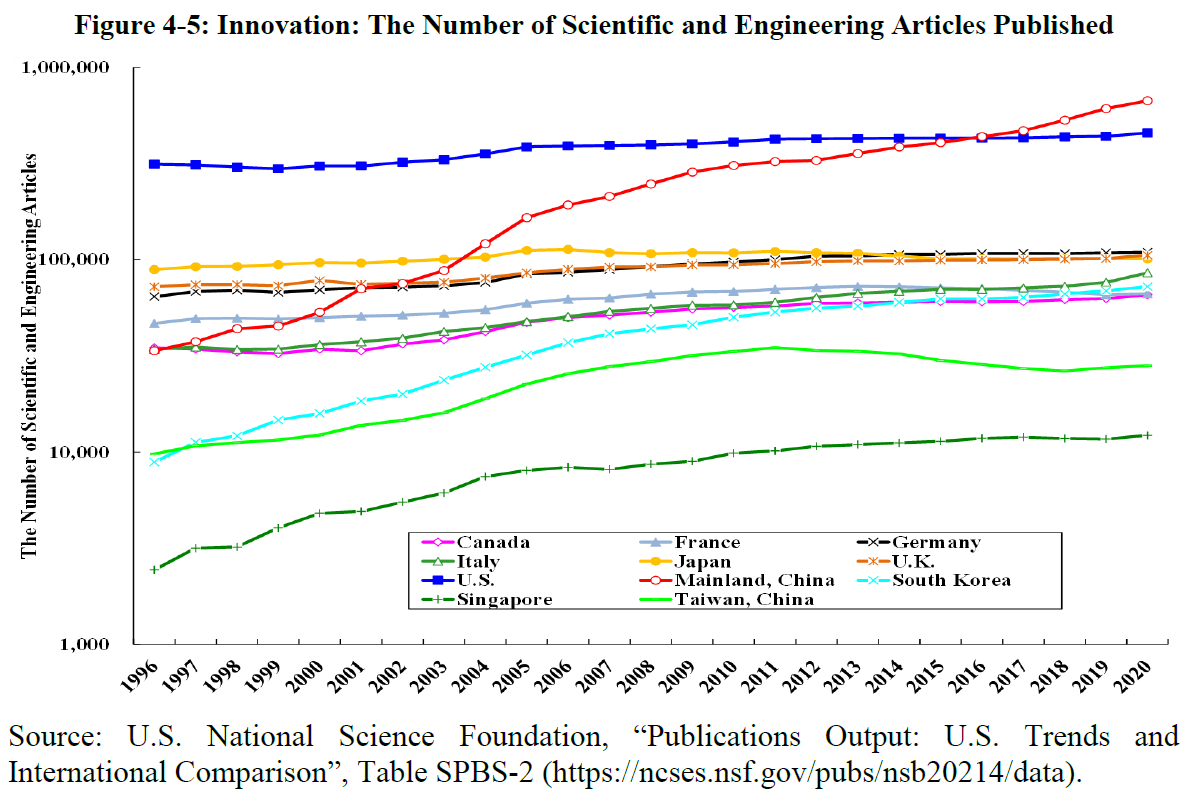
Another possible measure of the quantity of innovation output is the number of scientific and engineering articles published. The total number of science and engineering scholarly articles published in international professional journals by Mainland Chinese authors exceeded that by U.S. authors in 2016 (see Figure 4-5). Chinese authors now collectively publish the largest number of such articles in the world.
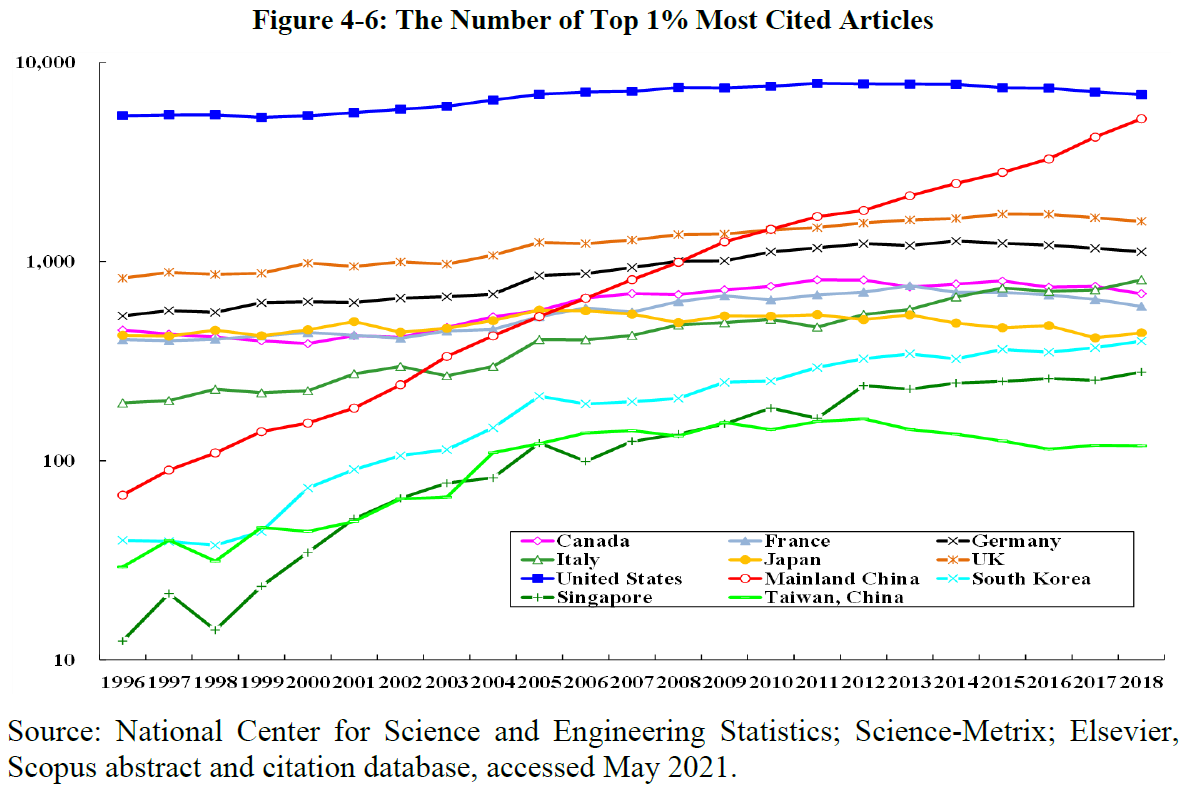
However, what should count more is not the total number of published articles, but the total number of citations received by the published articles. China trailed the U.S. and the European Union countries in the number of top 1% most cited scientific articles for many years, but finally caught up with the U.S. in 2019 (see Figure 4-6).
Environmental Preservation, Protection and Restoration
President XI Jinping committed China to peak its carbon emissions by 2030 and to achieve carbon neutrality by 2060. Prevention of climate change is not only a Chinese public good, but also a global public good. The objectives of carbon peaking by 2030 and achieving carbon neutrality by 2060 will be achieved through, for example: massive expansion of renewable energy, including hydro, massive solar and wind power farms, and potentially nuclear fusion, as sources of electricity generation, replacing the fossil fuels; ultra-high-voltage long-distance transmission of electricity from the West to the East; replacement of fossil-fuel vehicles with electric and hydrogen vehicles; substitution of air travel by high-speed rail travel domestically; and large-scale re-forestation.
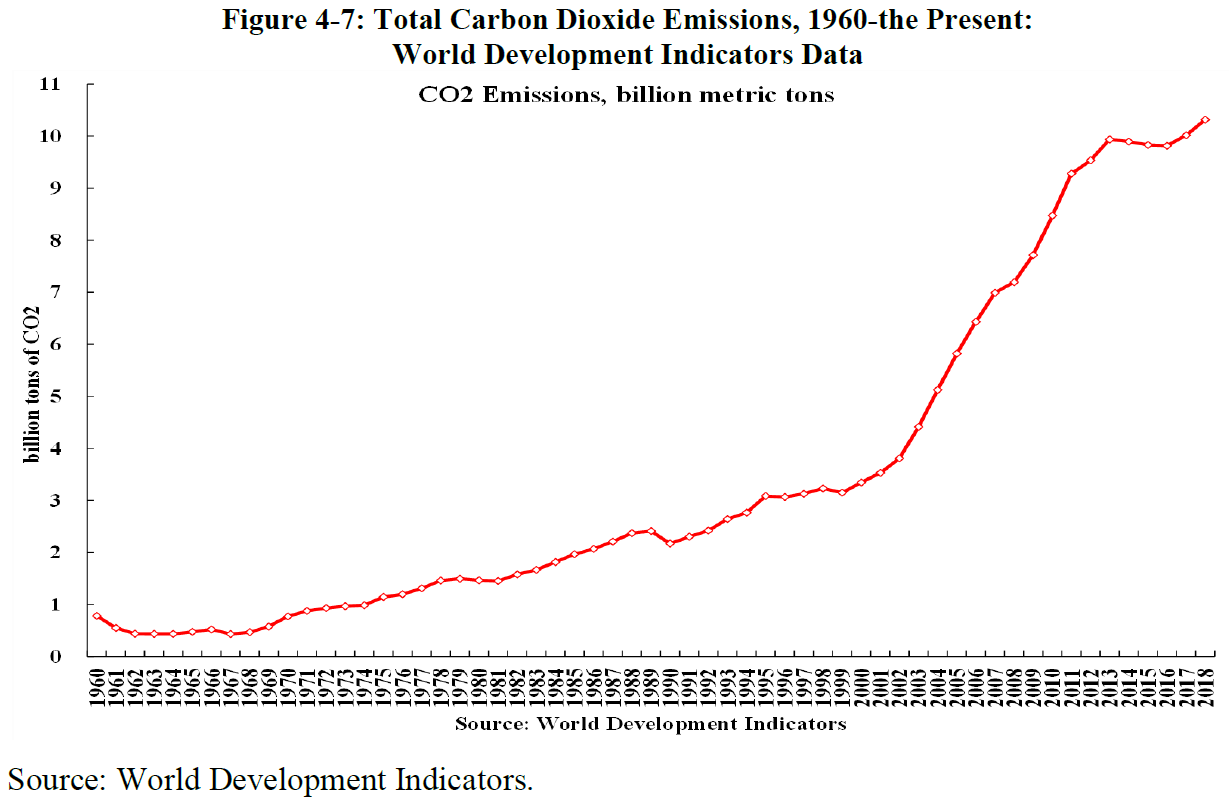
Carbon dioxide emissions have basically plateaued in China since the early 2010s, after a period of rapid increase (see Figure 4-7). The emissions have been growing very slowly in the past few years. If current trends continue, it is entirely feasible that emissions will peak before 2030 and fall to zero by 2060.
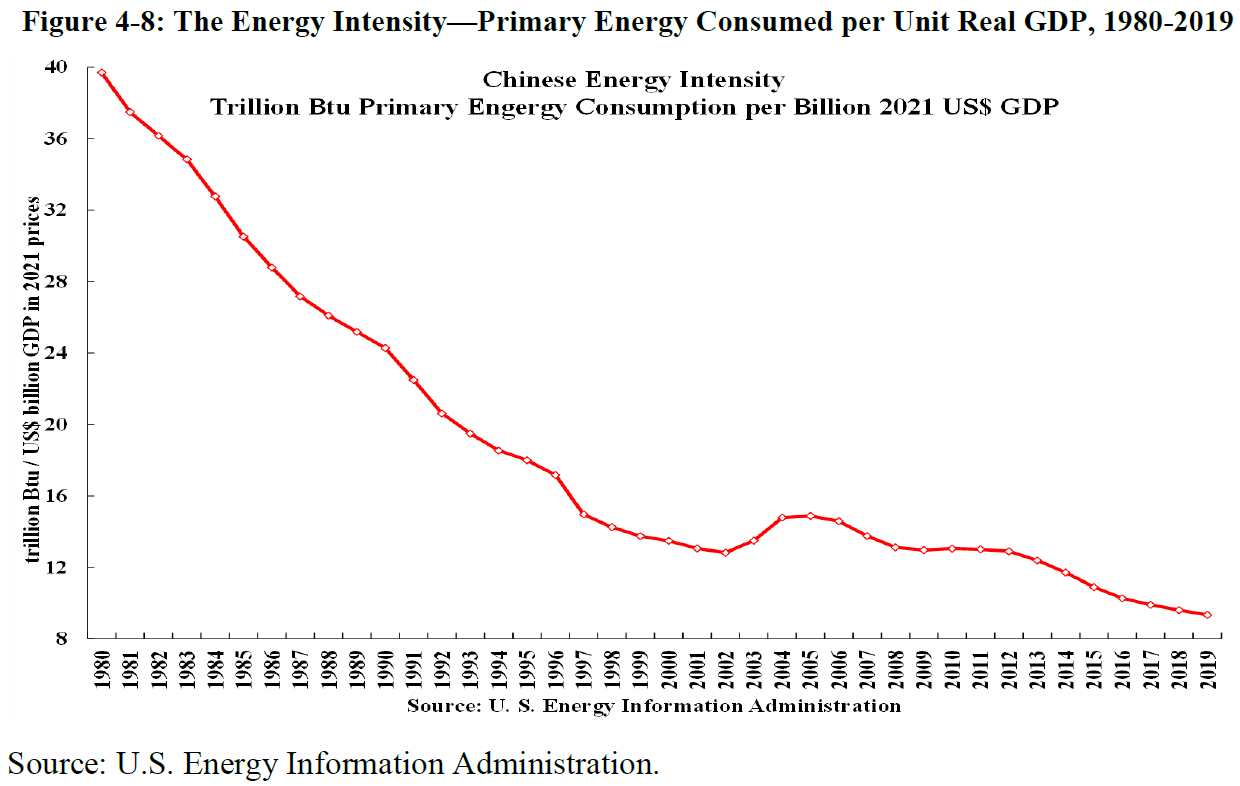
The energy intensity, defined as primary energy consumed per unit real GDP, has been declining over time in China (see Figure 4-8).[2] This is due to a number of factors: energy conservation efforts both public and private as a result of prices, taxes and regulatory requirements; technological improvements, e.g., higher efficiency and lower transmission losses; and the relative contraction of the energy-intensive secondary (manufacturing, mining and construction) sector and the relative expansion of the much less energy-intensive tertiary (services) sector.
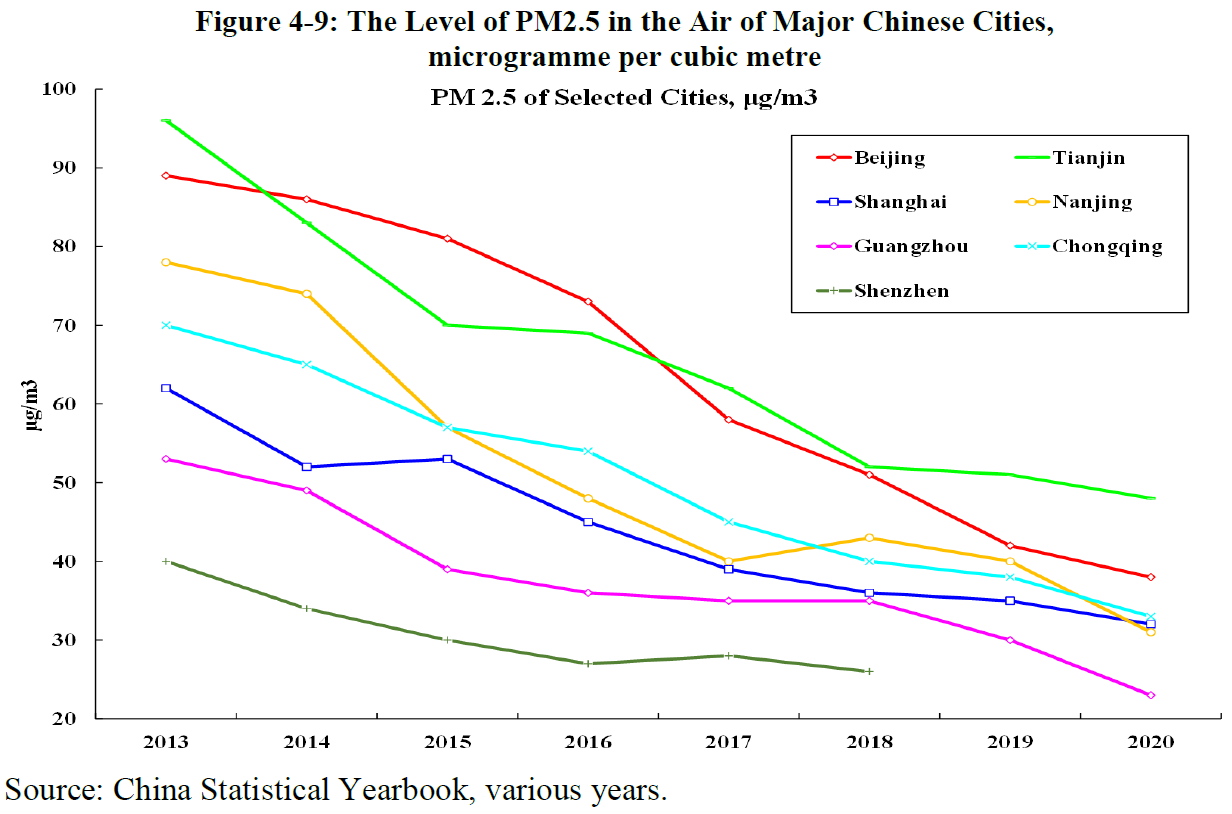
The quality of air in major Chinese urban centres has improved significantly. Fine particulate matter 2.5 (PM2.5) is an air pollutant that reduces visibility and causes the air to appear hazy when the level is high. It is also a concern for people's health. China implemented the new ambient air quality standard (GB3095-2012) in 2013. The levels of PM2.5 in the air of 31 major Chinese cities have been declining since. The actual levels of PM 2.5 of seven major cities—Beijing, Chongqing, Guangzhou, Nanjing, Shanghai, Shenzhen and Tianjin—between 2013 and 2020 are shown in Figure 4-9. The improvement over time is clearly apparent.
Poverty Alleviation
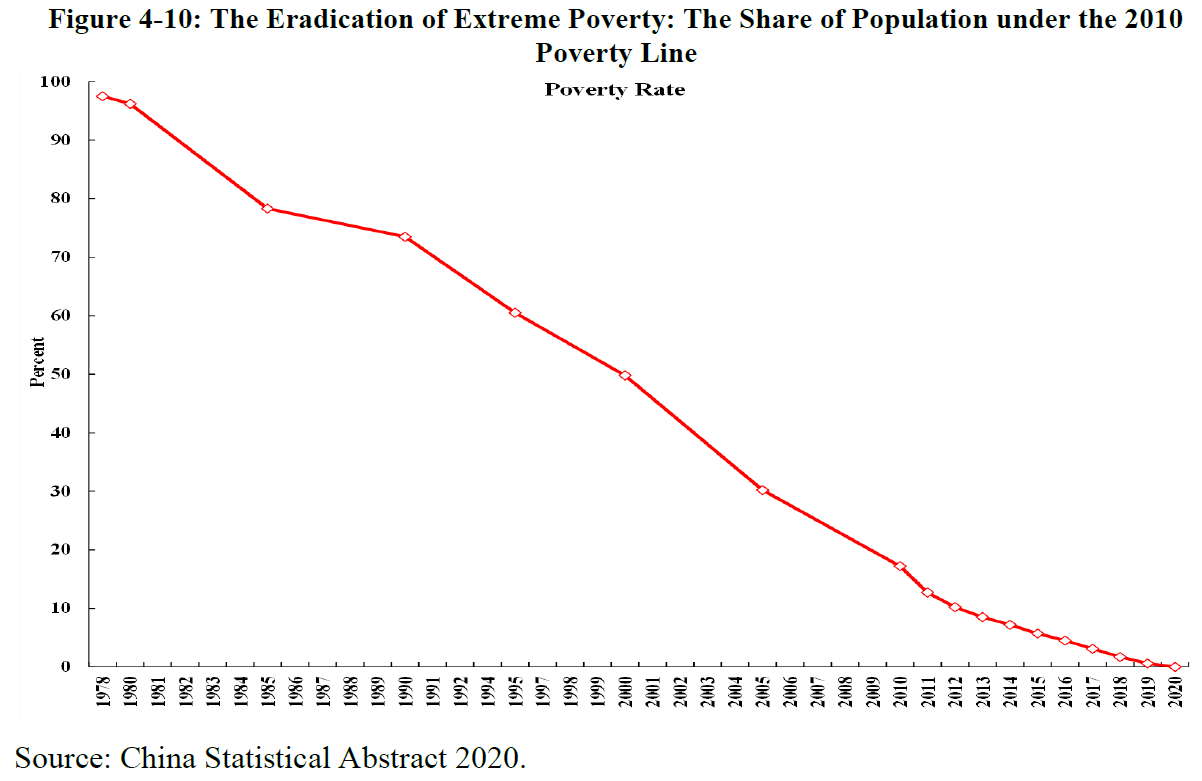
China has been the most successful in the eradication of chronic extreme poverty. The Chinese poverty standard, adopted in 2010, defines a family to be in poverty if its annual per capita income is below 2,300 Yuan in 2010 prices. This is equivalent to approximately 3,054 Yuan in 2021 prices (US$479). In 1978, before the beginning of the economic reform and opening, the poverty rate according to this standard was a whopping 97.5%! By the end of 2020 it reached zero. (See Figure 4-10). Granted that this is still a rather low level of annual income per capita, but it is slightly more than US$1.30 per person per day, higher than the United Nations standard of one U.S. Dollar a day. We should emphasise that this is a permanent eradication of extreme poverty, rather than a one-off relief. The formerly extremely poor are now able to provide a decent living for themselves in a sustainable manner.
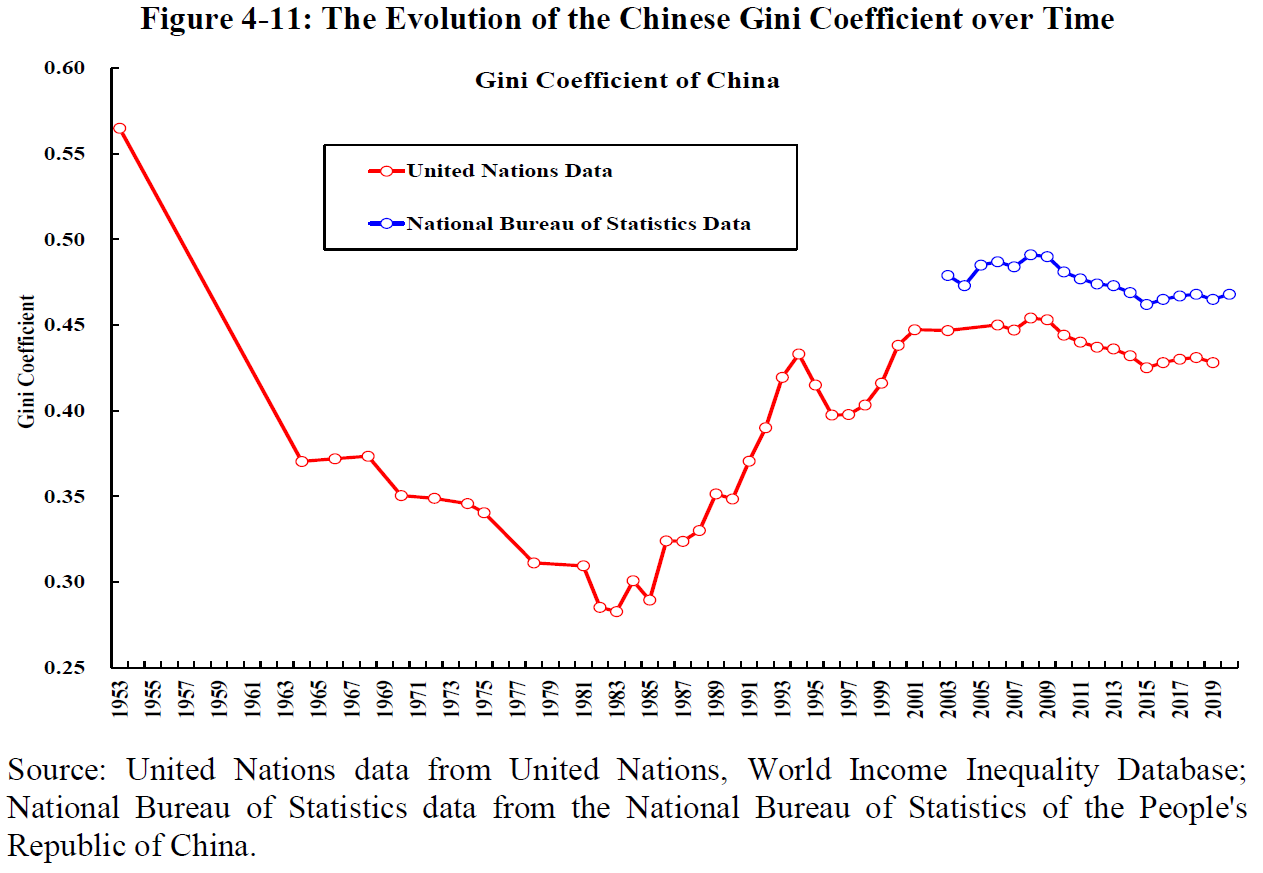
However, despite the significant progress in the alleviation of poverty in China, the degree of income inequality in China has increased significantly since 1983 (see Figure 4-11). According to the National Bureau of Statistics of China (NBSC), the Gini coefficient for China stood at 0.47 in 2020, comparable to the 0.49 for the U.S. Historically, the Chinese Gini coefficient fell from 0.56 in 1953 to 0.28, its lowest point, in 1983, a tremendous improvement, according to data compiled by the United Nations. It then turned around and rose to a peak of 0.45 (0.49 according to NBSC) in 2008. It has since declined to 0.43 (0.47 according to NBSC) in 2019. This is a very high level of income inequality, but not inconsistent with Mr. DENG Xiaoping’s policy of letting some people get rich first. It is now time to let other people get rich too. This is the reason for the “Common Prosperity” policy.
[1] The 2021 figures are based on an announcement by the Ministry of Education on 17 May 2022.
[2] The energy consumed per unit GDP decline by a further 2.7% between 2021 and 2020. However, the energy intensity of China is still approximately 1.5 times the global average.